
What Is Website Traffic Analysis?
A website traffic analysis is a way of measuring and evaluating the number of and behavior of visitors to your site.
This can involve tracking metrics like views, bounce rates, traffic sources, and more.
And website traffic analysis tools are how you gain that information. To help you gain insights you can use to optimize your site's performance and improve the user experience (UX).
Why Is Website Traffic Analysis Important?
Performing a website traffic analysis lets you:
- Identify which marketing campaigns are working by seeing which channels drive the most traffic
- Identify low-engagement pages that need to be improved
- Find high-traffic pages you can further improve by optimizing the content
- Understand your different audience demographics to tailor content and marketing strategies effectively
- Detect technical issues that might be affecting your site's performance
9 Top Website Traffic Analysis Tools
Now that you know more about the benefits of this type of analysis, let’s get to the best tools for the job.
1. Traffic Analytics
Traffic Analytics provides estimates about any website’s traffic. And makes it easy to do a competitive analysis.
It provides a look at:
- How many visitors a site is getting
- Where they’re coming from
- How many of them are new vs. returning
- What pages they’re landing on
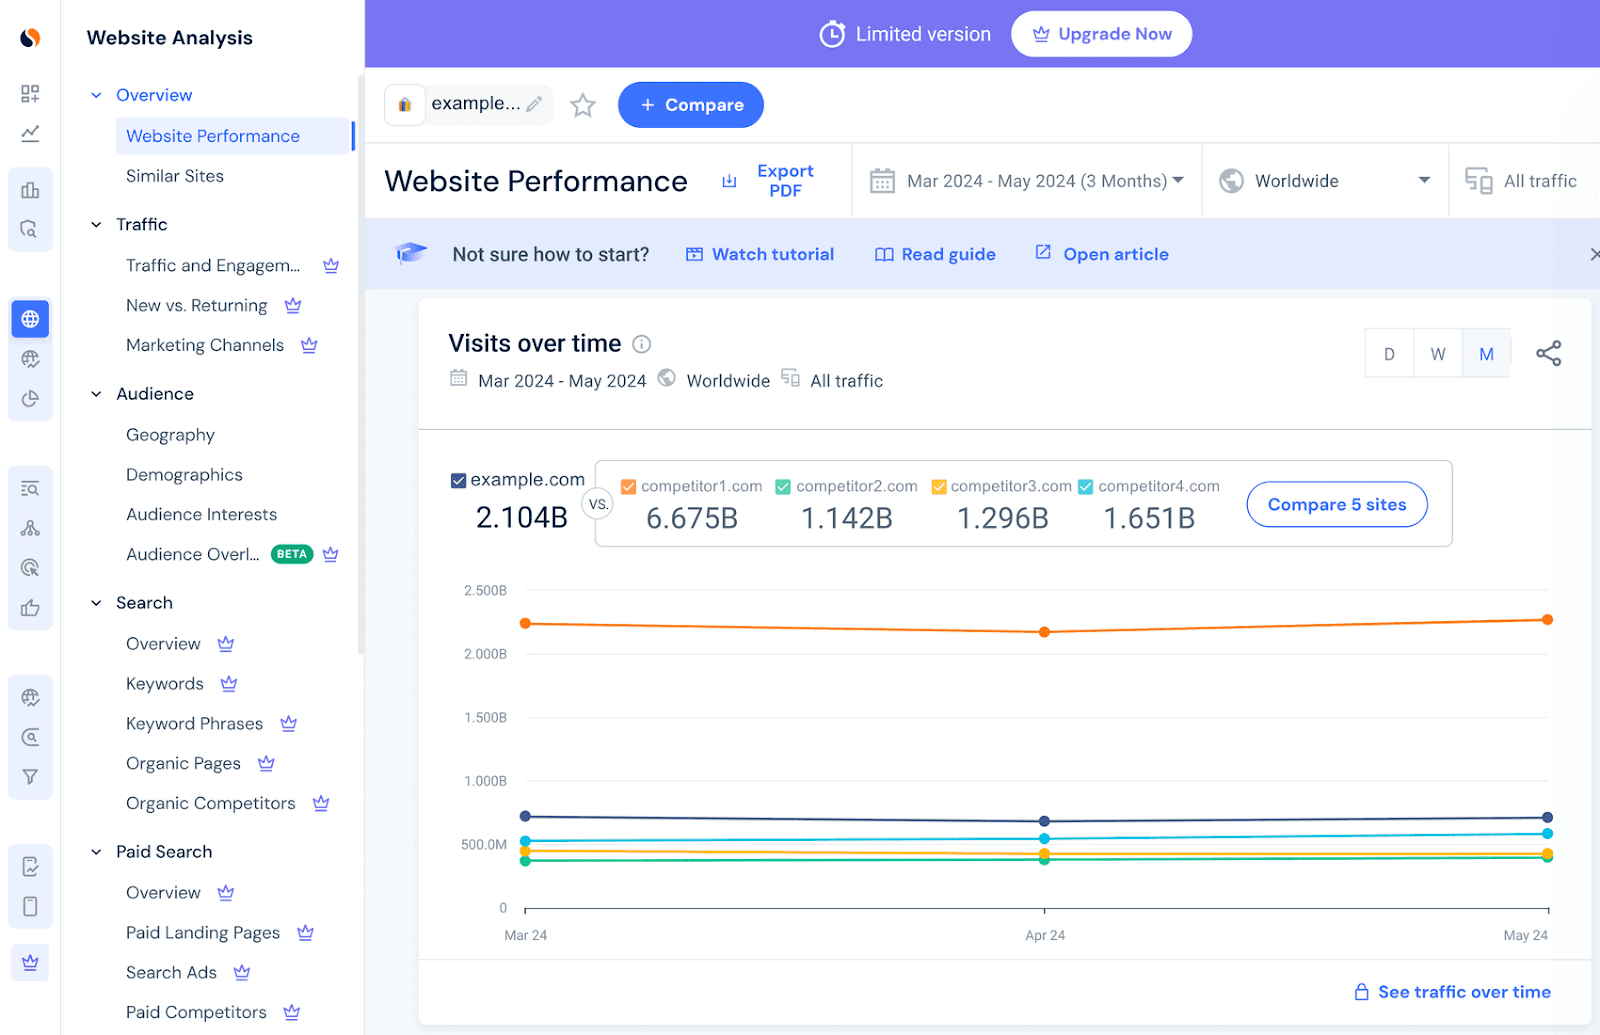
It breaks down data by geographic location, channels, and device.
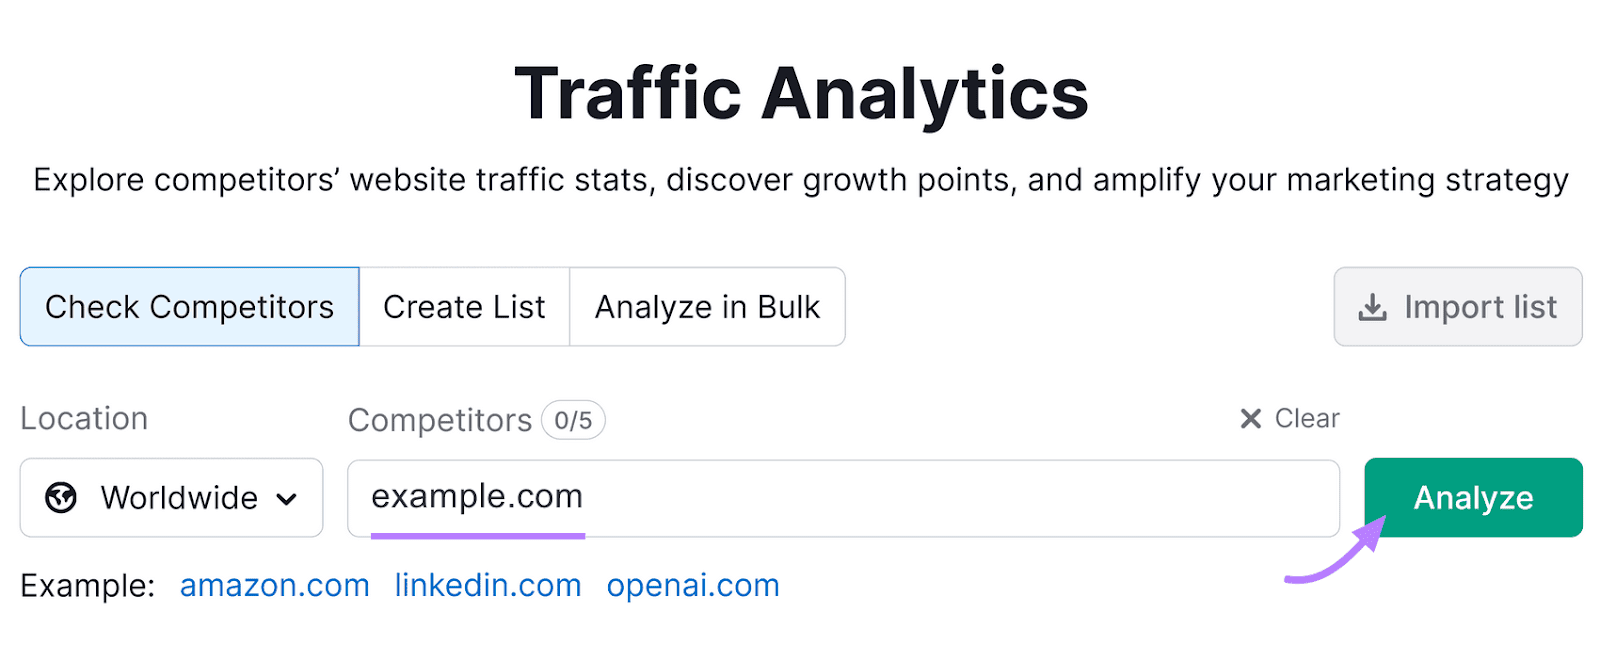
Open the tool, enter your domain, and select the location. Click "Analyze."
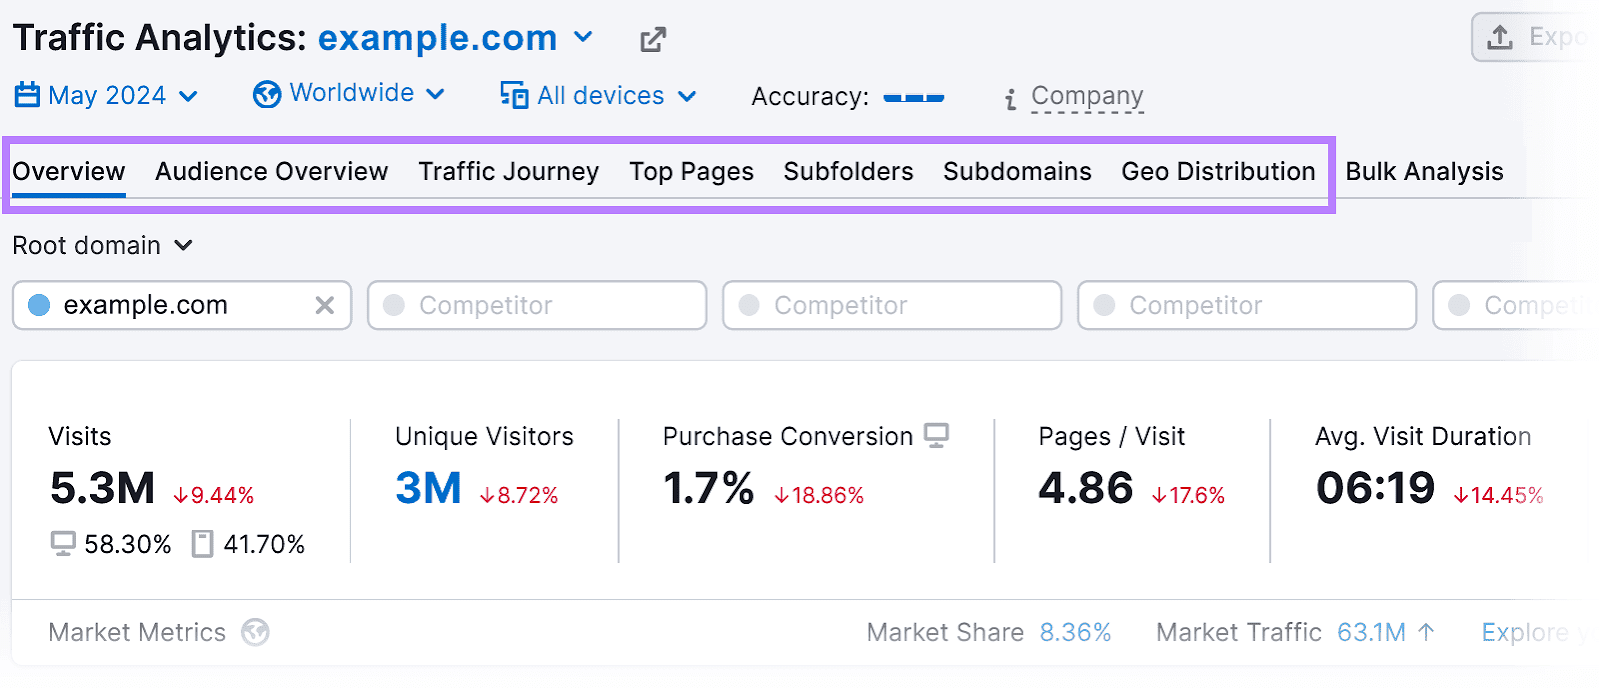
You'll see seven different reports:
- Overview: A snapshot of the site’s traffic
- Audience Overview: Shows demographic information about visitors
- Traffic Journey: Identifies the main channels that drive traffic to the site
- Top Pages: Highlights the most popular pages on the site
- Subfolders: Analyzes traffic distribution within specific subfolders of the domain
- Subdomains: Details traffic metrics across different subdomains
- Geo Distribution: Offers a geographic breakdown
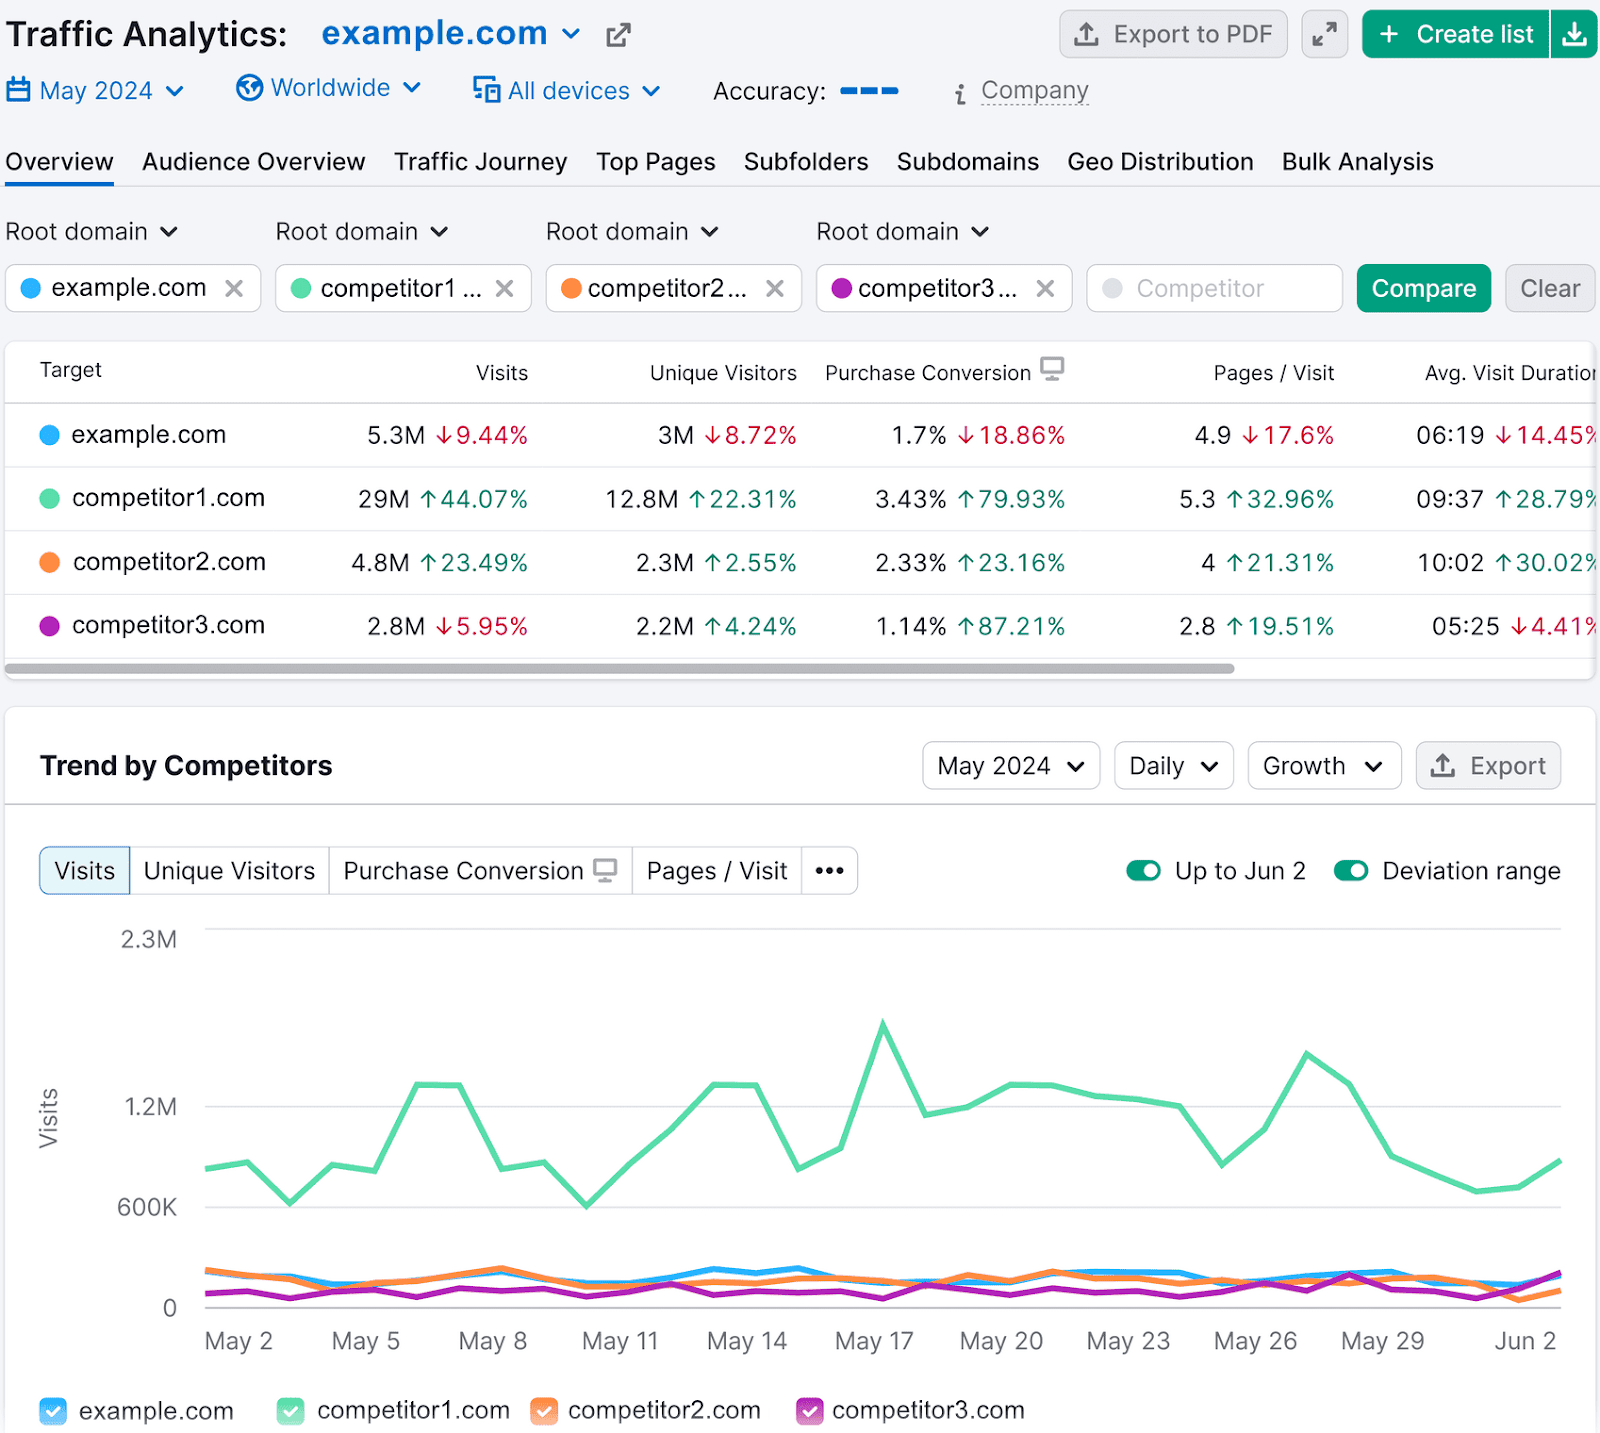
From the “Overview” report, enter your competitors’ domains in the fields under the tabs. And click “Compare.”
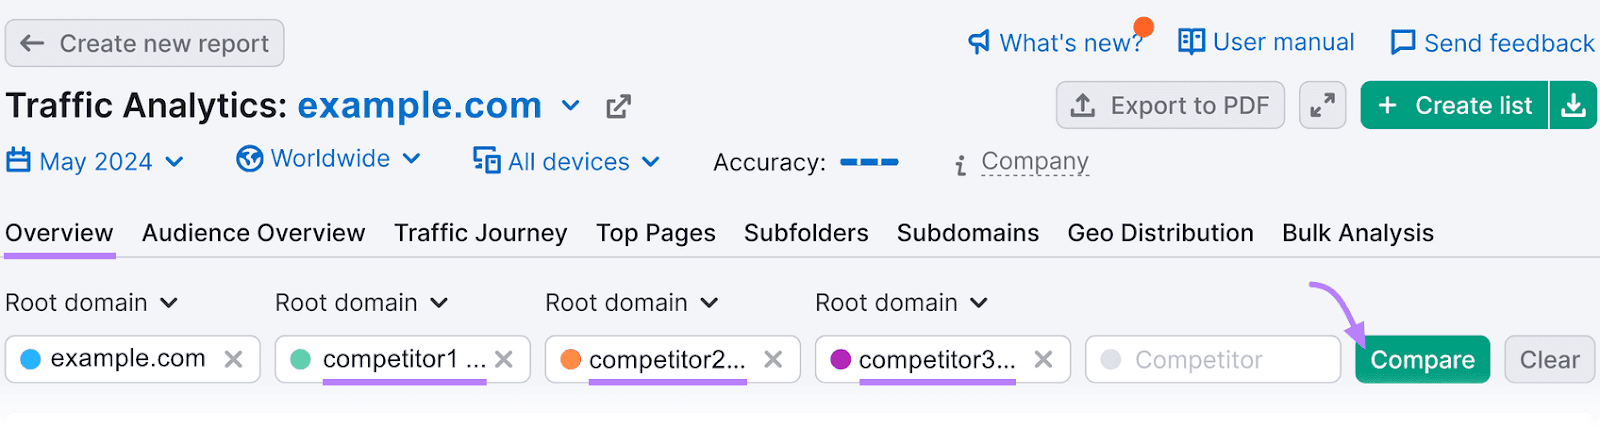
You'll see metric comparisons. Which can reveal strengths and weaknesses.
What We Like
The Traffic Analytics tool offers detailed insights into how users engage with a website. While it can be useful for getting a snapshot of your own website’s performance, it’s especially useful for evaluating the competition.
The tool even provides a handy Audience Overview report. Which you can use to identify new segments you might want to reach.
You can even see how performance has changed over several years. Because you can access data from as far back as 2017.
Pricing
You can try Semrush for free. And there are three paid plans:
- Pro: $139.95/month
- Guru: $249.95/month
- Business: $499.95/month
2. Organic Traffic Insights
Organic Traffic Insights combines your Google Analytics 4 (GA4), Google Search Console (GSC), and Semrush data into one dashboard. Providing a comprehensive view of your website's traffic and organic search performance.
The tool details the specific search terms that lead visitors to your pages, the devices they use, and more.
Open the tool and set up a project. Follow the Organic Traffic Insights configuration guide for help with setting it up.
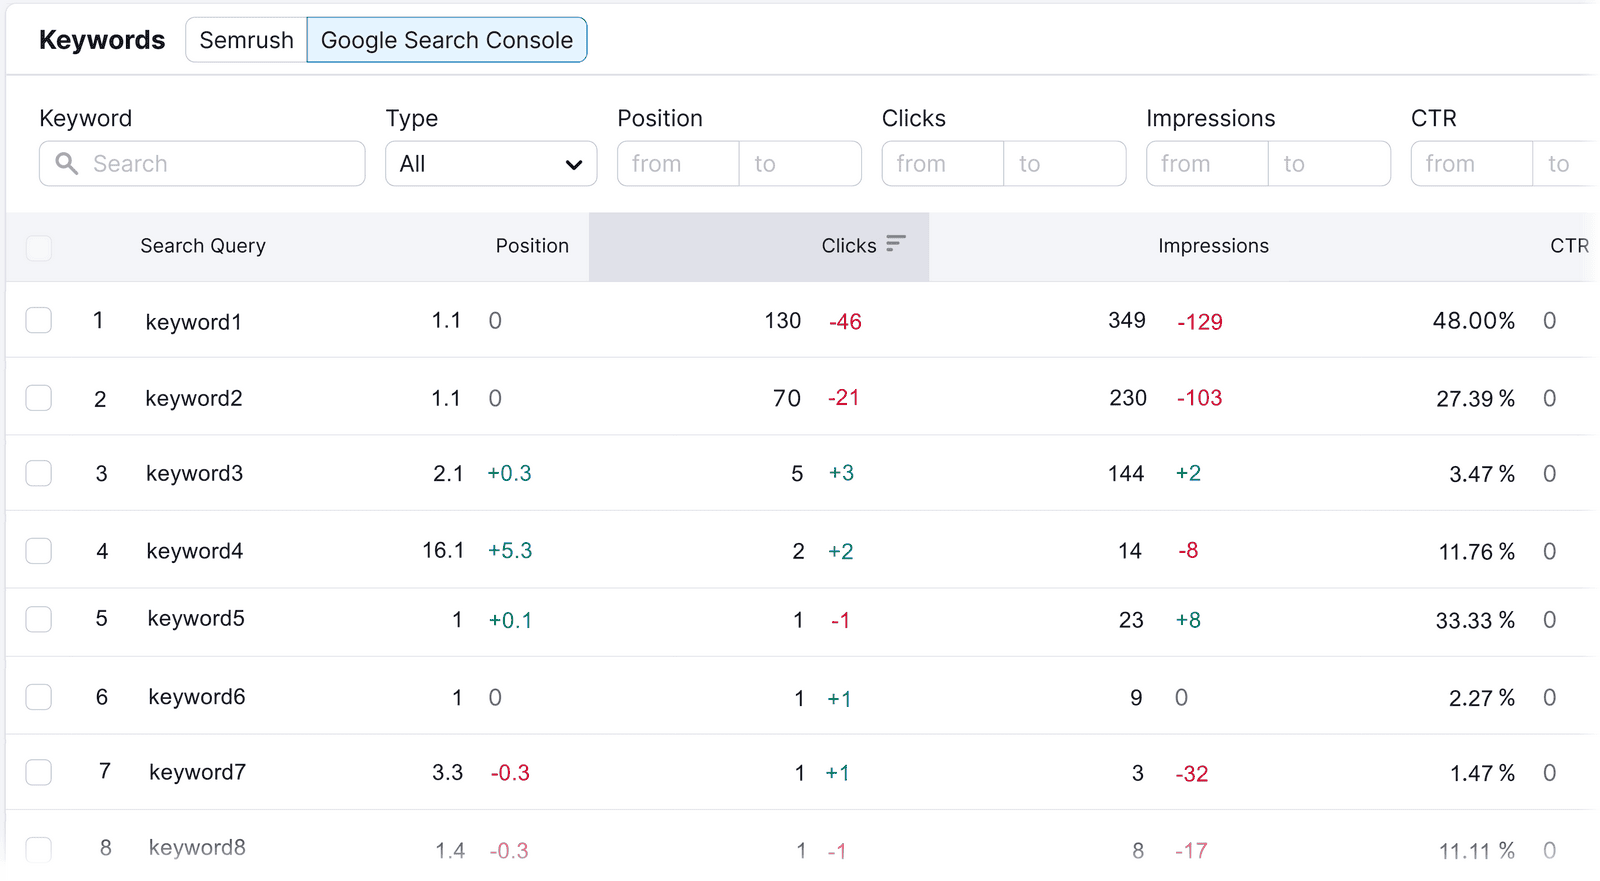
Once done, you'll see a report like this:
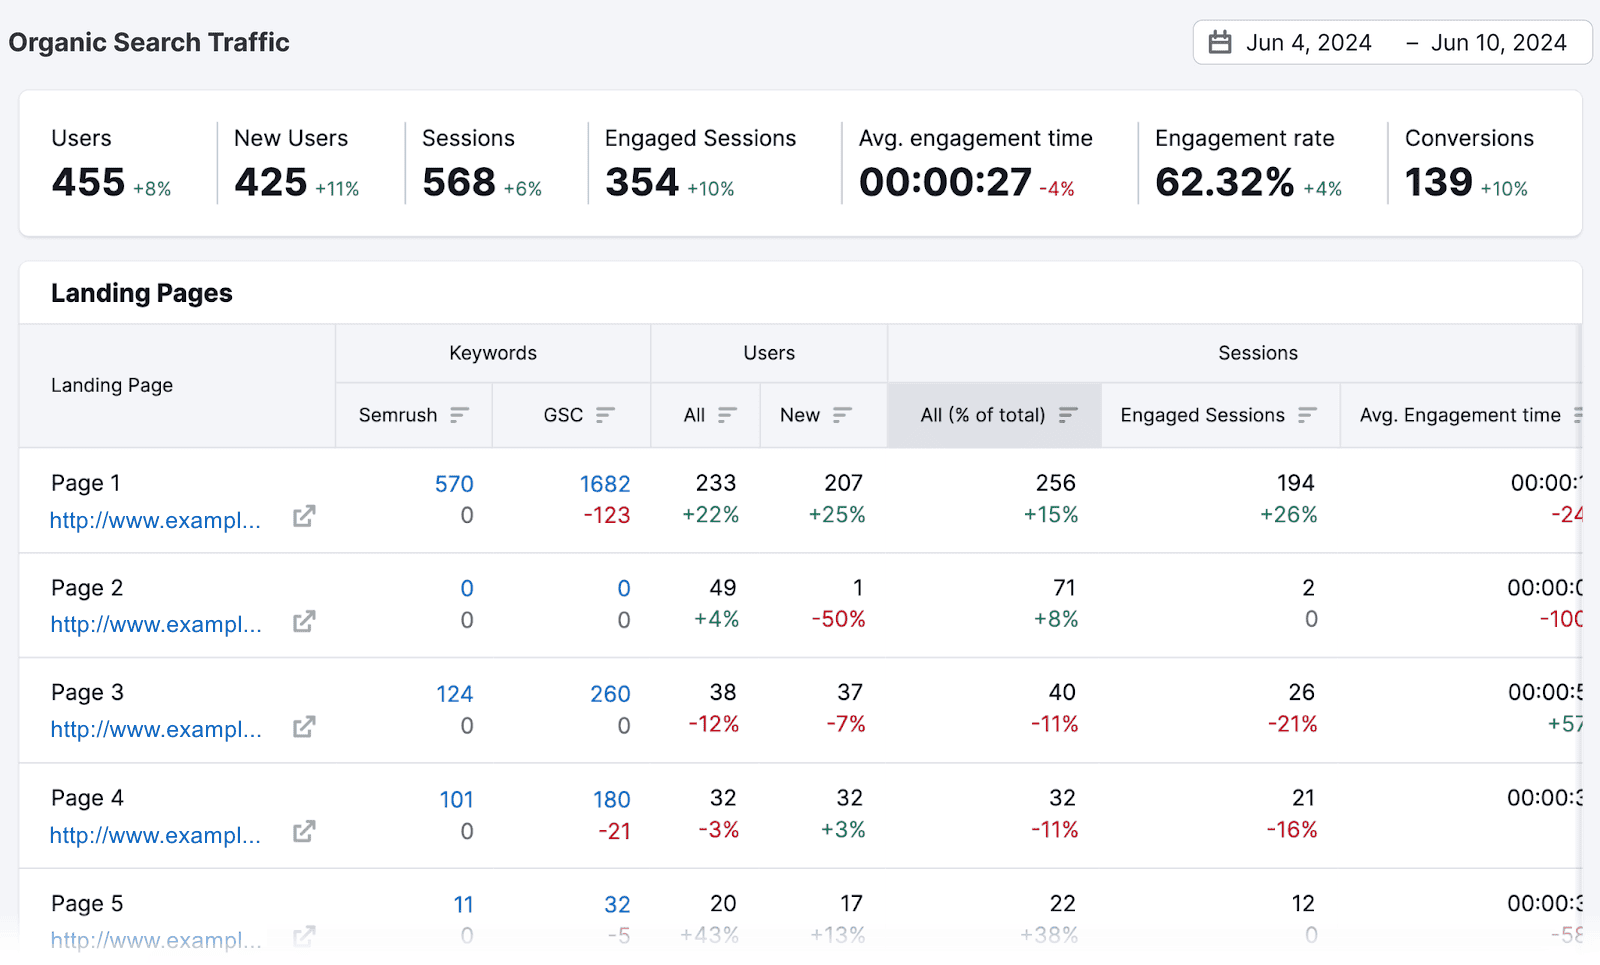
Click on the hyperlinked number in the "Semrush" column under the "Keywords" section.
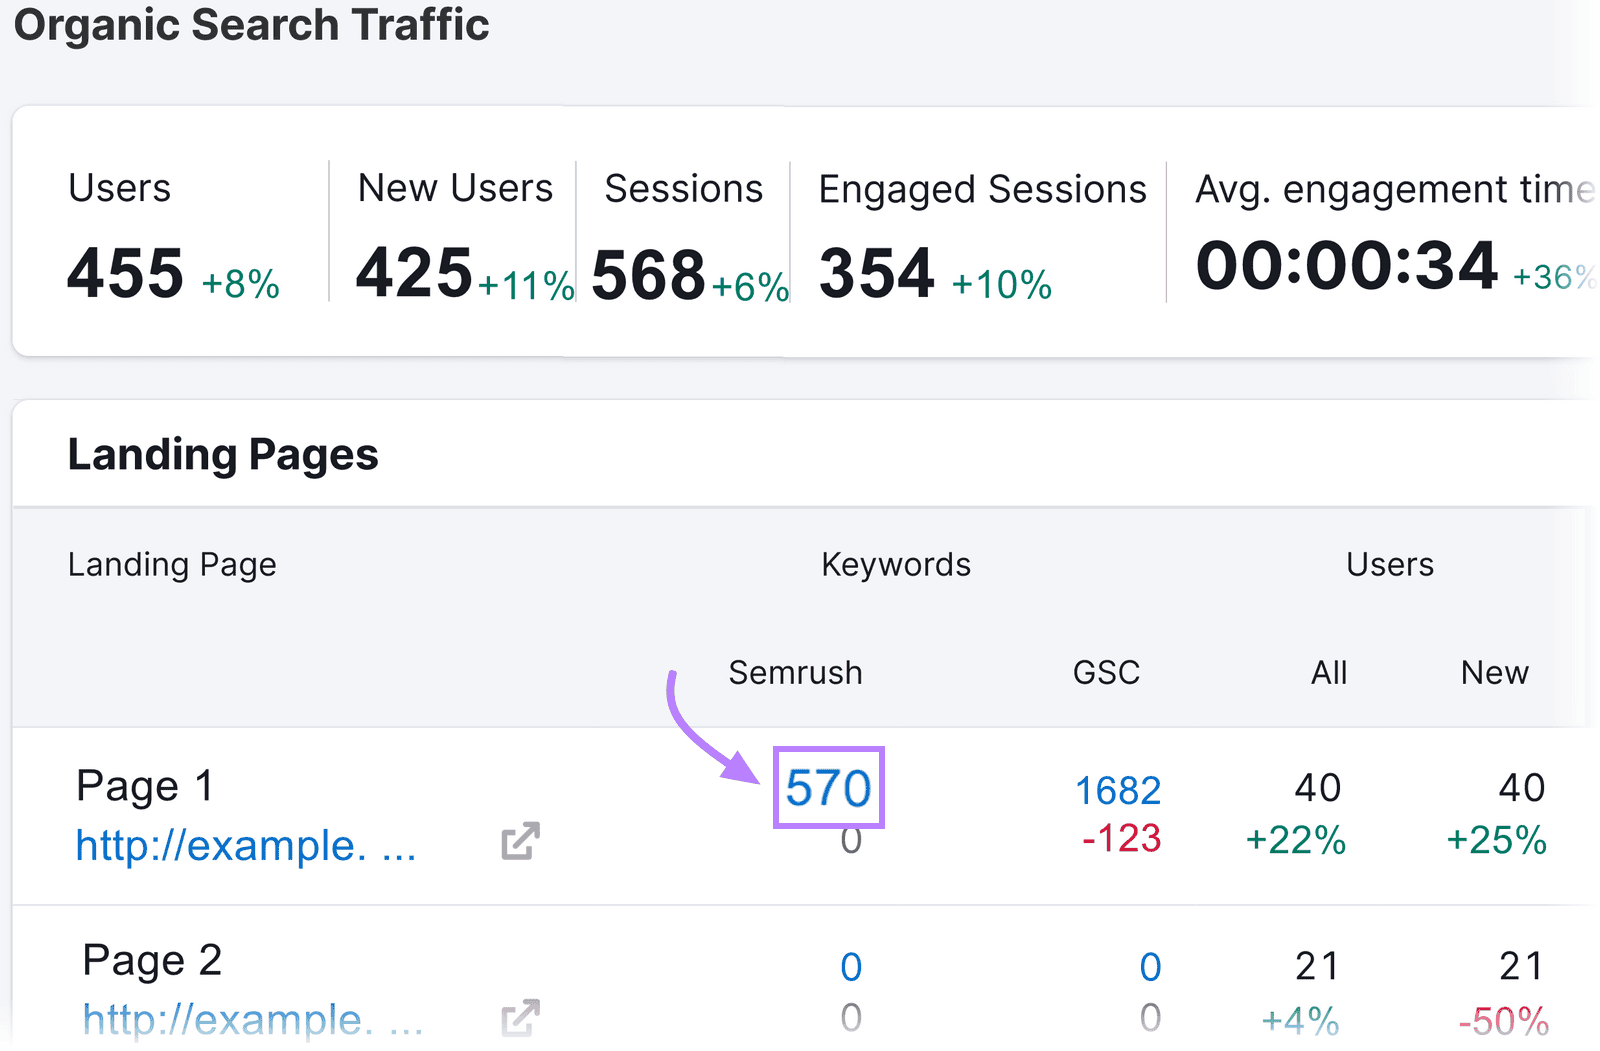
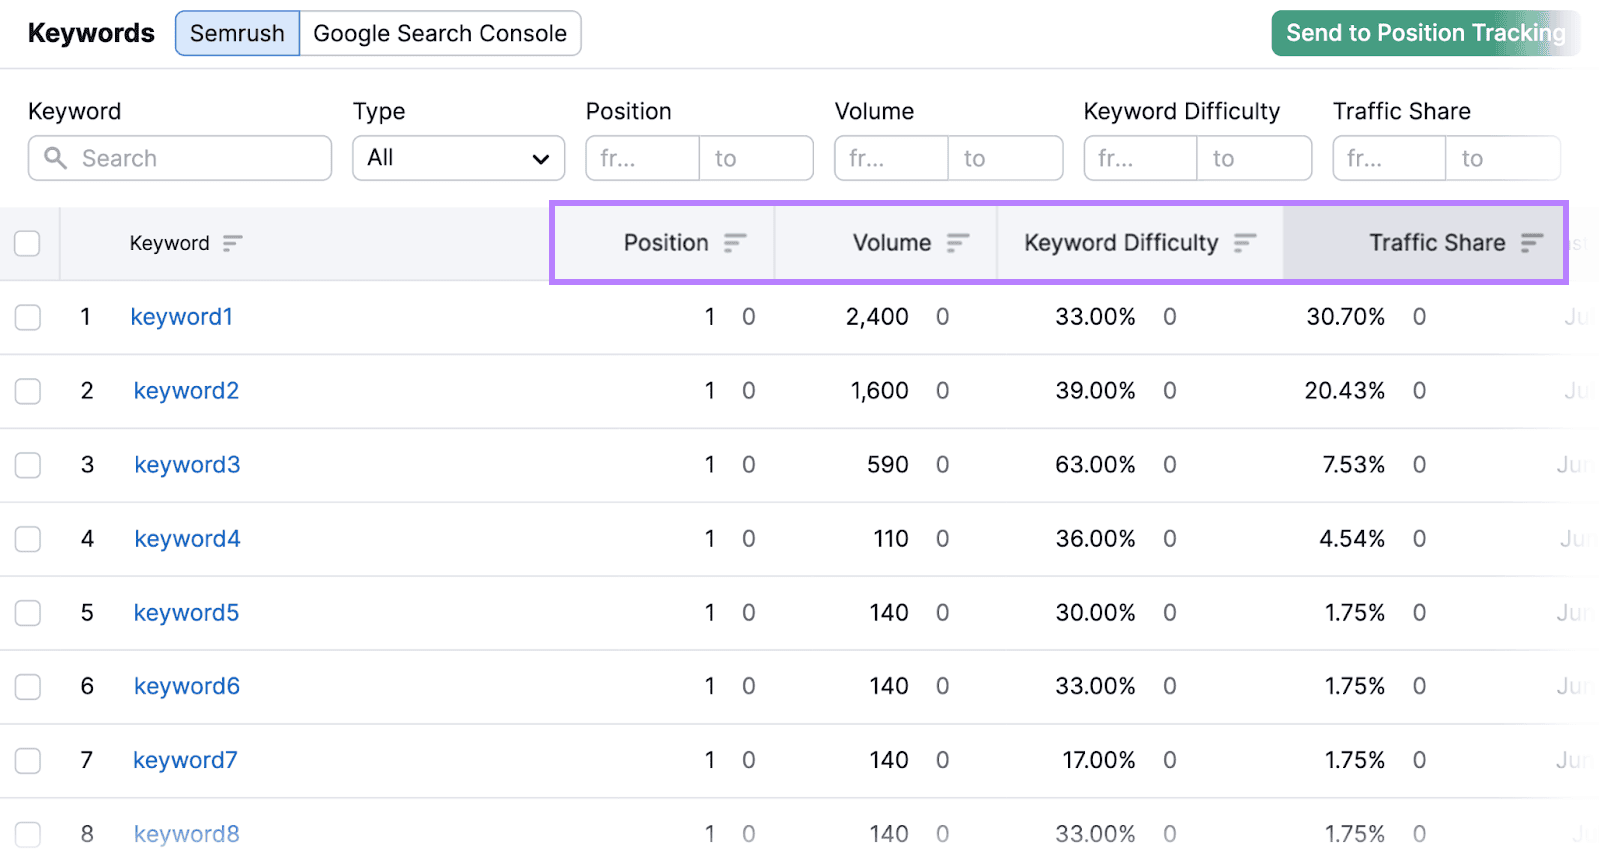
You'll then see all the keywords the corresponding page is ranking for. Along with metrics like ranking positions, search volume, keyword difficulty, and traffic share.
To see “not provided” keywords from GA4, click on the hyperlinked number in the "GSC" column in the "Keywords" section.
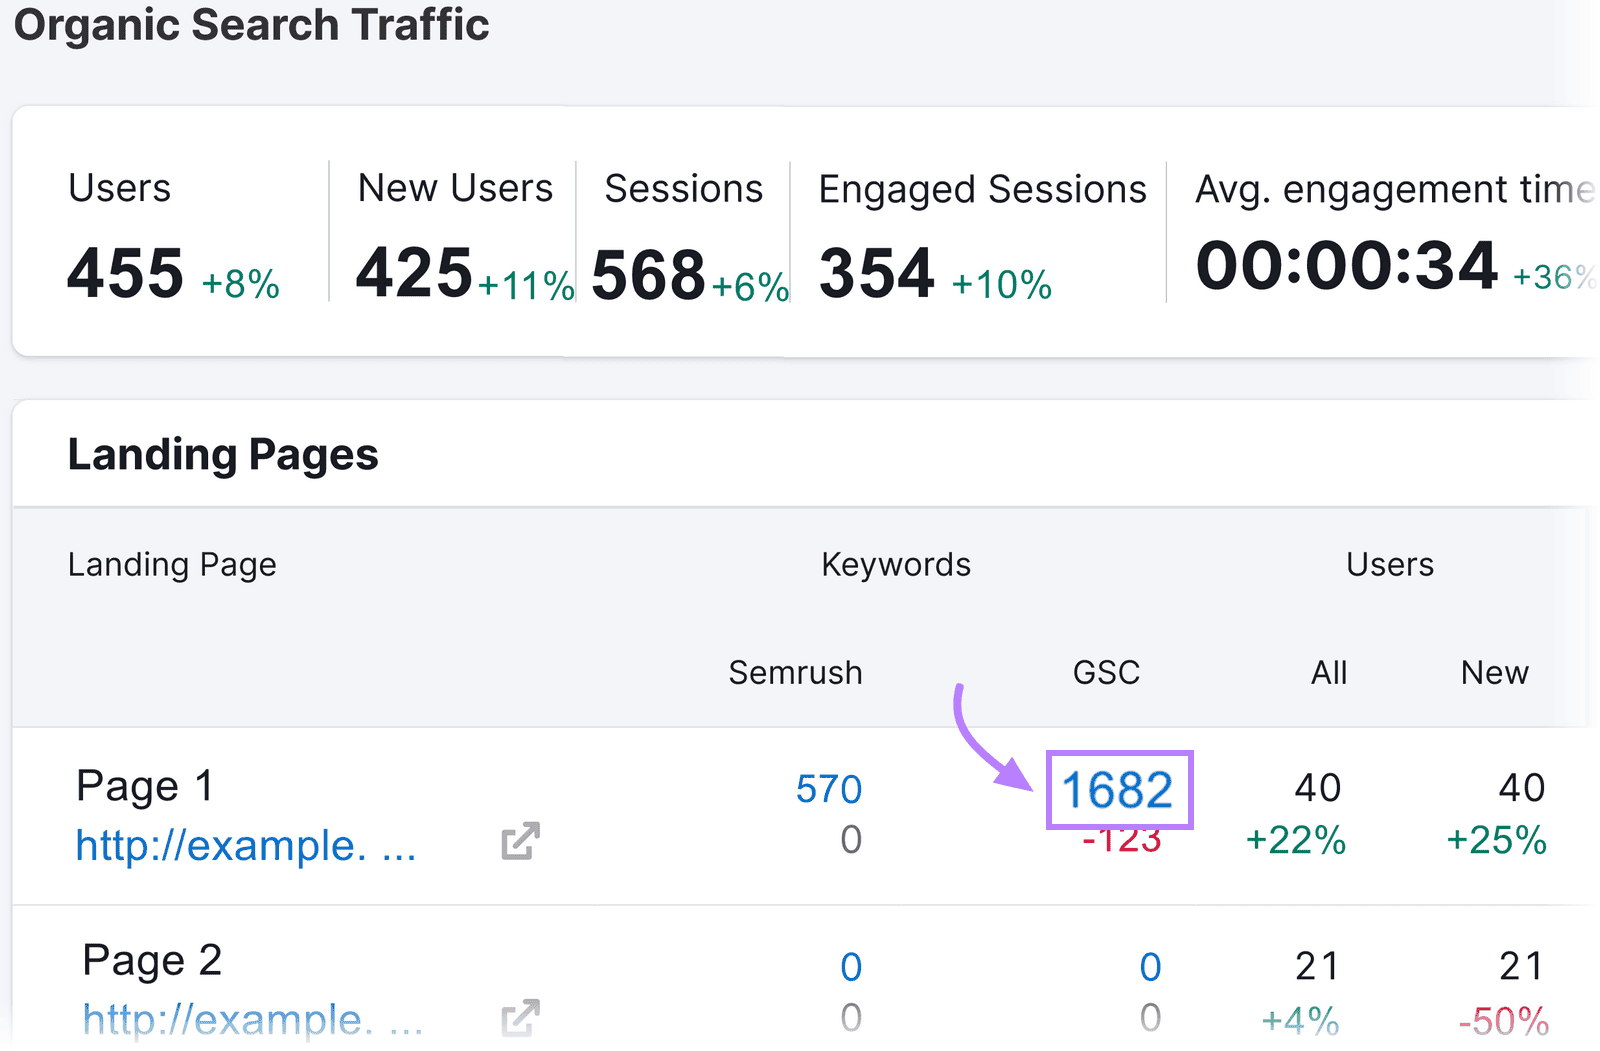
You’ll see a complete list of keywords driving traffic to the page in question—including the “not provided” keywords.
Gaining these insights helps you identify high-value keywords and keywords for which your rankings are declining. It also enables you to understand your organic growth more deeply.
This can help you refine your SEO strategy.
What We Like
Organic Traffic Insights allows you to easily gauge your website’s performance from a single, easy-to-read dashboard.
And it lets you cross-reference data from across multiple platforms. To give you a truly accurate look at your site’s performance.
Plus, the Organic Traffic Insights tool reveals keywords that Google labels as "not provided."
Pricing
You can try Semrush for free. And there are three paid plans:
- Pro: $139.95/month
- Guru: $249.95/month
- Business: $499.95/month
3. Google Analytics 4
With a GA4 account, you can monitor common metrics such as views, bounce rates, and average session duration. To better understand how many people are arriving at your site and their behavior.
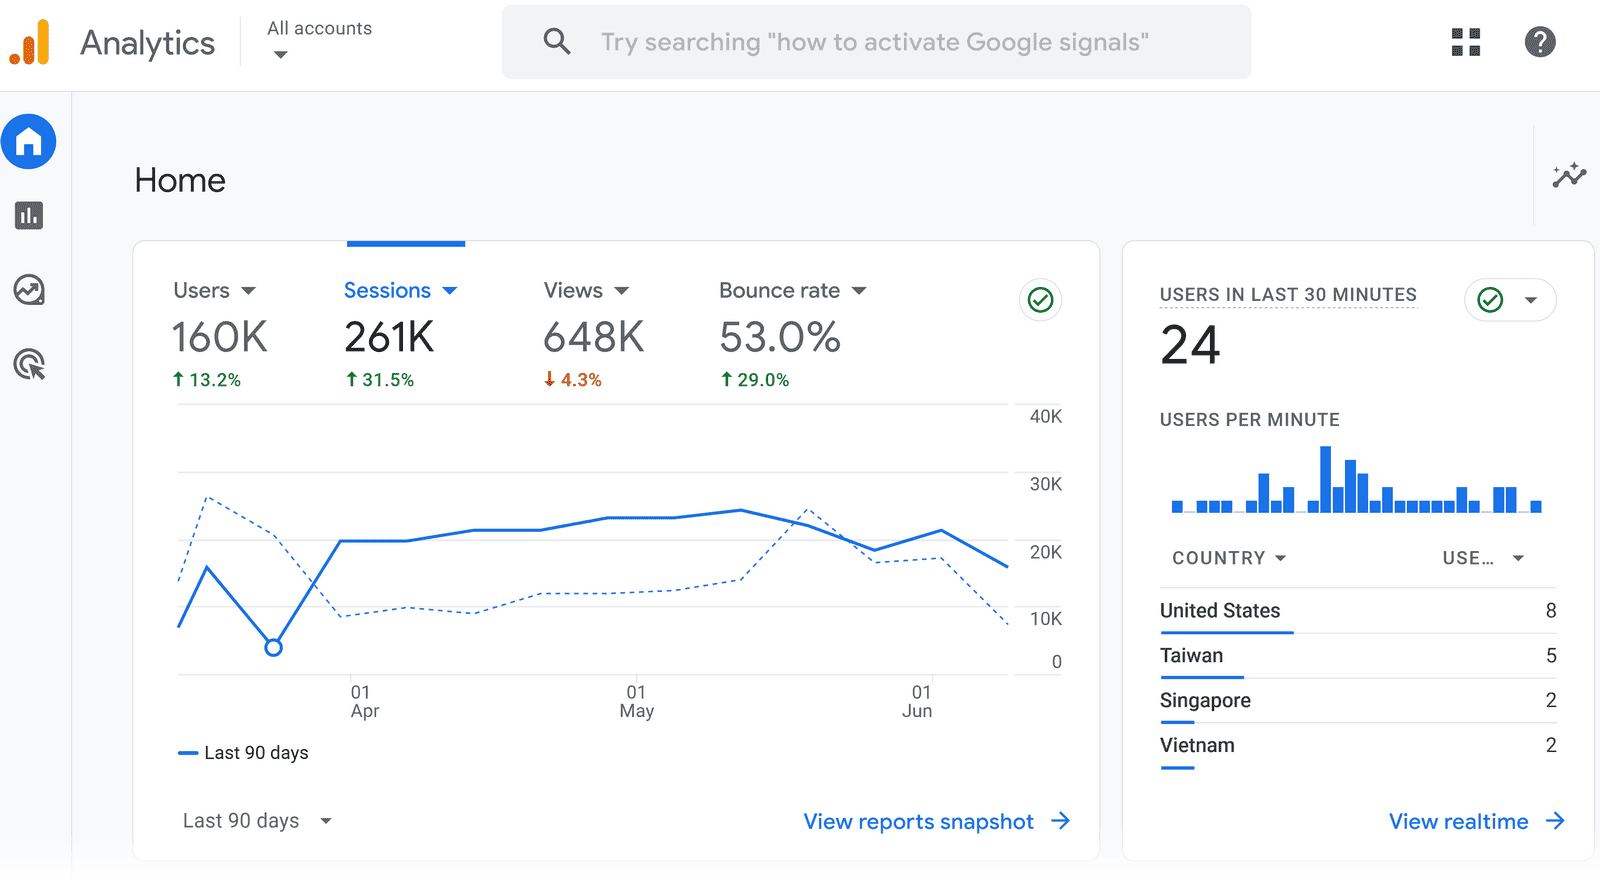
GA 4 also offers:
- Real-time data tracking: Monitor live visitor activity
- Audience demographics and interests: Understand the age, gender, and interests of your visitors
- Behavior flow analysis: Visualize user paths through your site to identify popular pages and potential drop-off points
- Conversion tracking: Measure the success of your defined goals, whether it’s a purchase, sign-up, or any other key action
- Customizable reports and dashboards: Create personalized reports to focus on the most relevant metrics for your business
What We Like
Google Analytics excels at providing real-time user behavior insights.
And you can customize your reports to better analyze marketing campaigns. Or to monitor user engagement.
Pricing
Google Analytics is free.
4. Google Search Console
Log in to GSC (or create an account) to gain access to reports that help you understand and improve your site's presence in Google search results.
It reports on the total traffic (expressed as clicks) you get from search results.
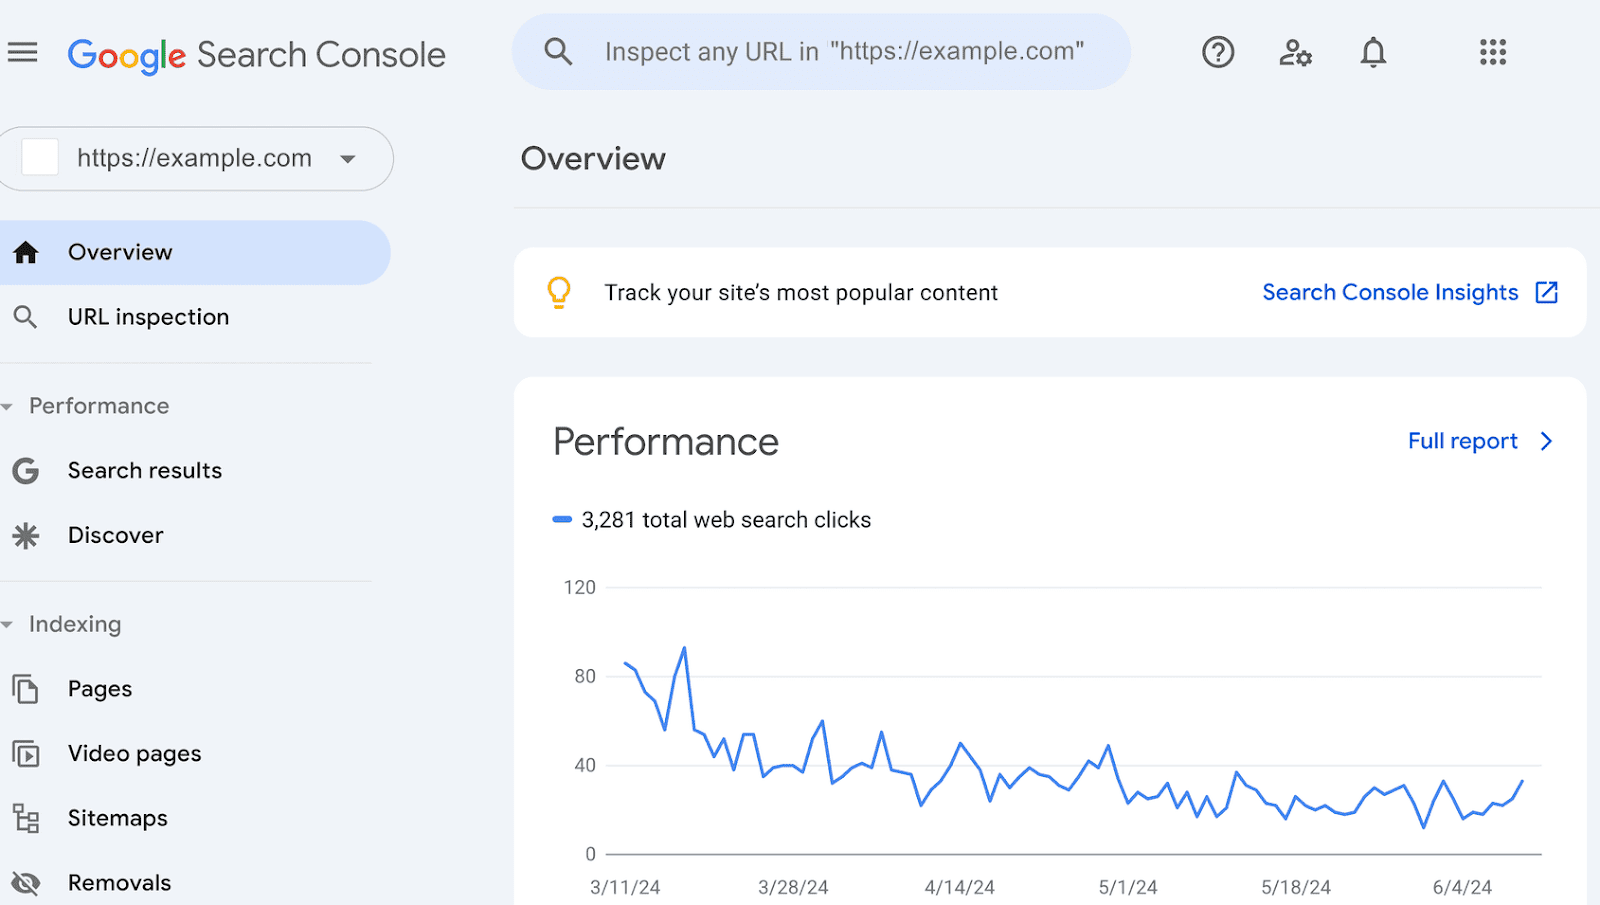
And GSC enables you to identify technical issues that are preventing your pages from being indexed. So you can optimize your site for better visibility.
You can also use it to inspect specific URLs, verify that your site is mobile-friendly, and submit your sitemap to Google.
What We Like
GSC’s URL inspection feature allows you to ask Google to inspect your page again if you've updated it. This helps changes appear faster in search results, so the page can start driving traffic that much quicker.
And it’s simple to use. Making it easier for you to keep tabs on how your website is performing in search.
Pricing
Google Search Console is free to use.
5. Similarweb
Similarweb provides detailed insights into your website's traffic. It tracks metrics like total visits, engagement levels, and traffic sources.
The tool helps you understand visitor behavior and gain insights into their characteristics.
It also offers competitive benchmarking to see how your site stacks up against others in your industry.
What We Like
Similarweb’s traffic source analysis breaks down exactly where your visitors come from—organic searches, social media, referral links, etc.
You can use this data to invest more wisely in the right types of campaigns.
Pricing
Four paid plans are available:
- Starter: $149/month
- Professional: $399/month
- Team: Custom pricing available on request
- Enterprise: Custom pricing available on request
6. Matomo
Matomo is an open-source website analytics platform that provides comprehensive insights into your website's traffic while prioritizing data privacy.
It tracks metrics like visits, bounce rate, average session duration, and traffic sources.
Matomo is highly customizable and offers both cloud and self-hosted options. Giving you control over your data.
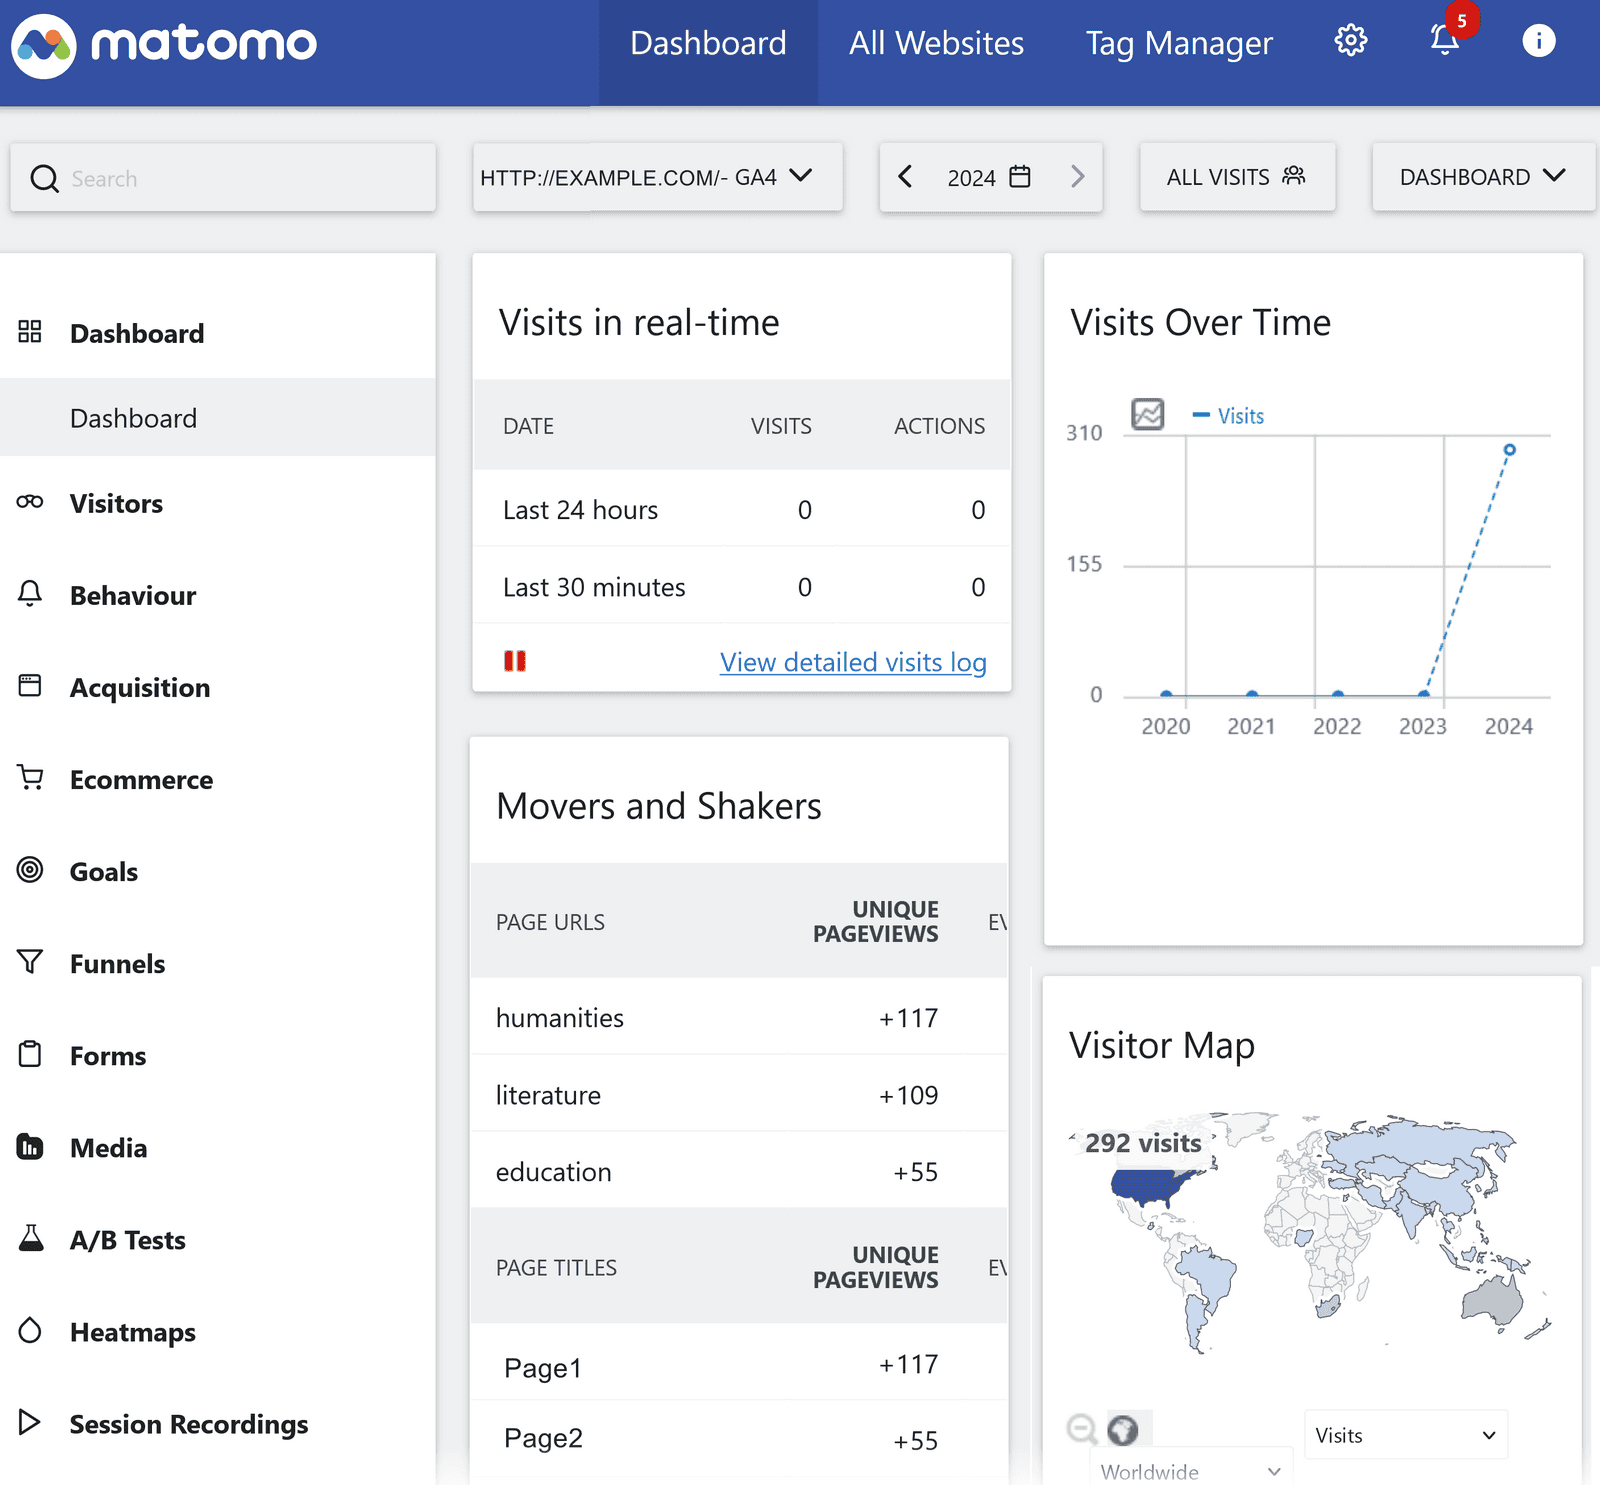
Matomo also offers real-time data updates, heatmaps to show user interactions, and conversion tracking.
What We Like
Matomo offers real-time user activity tracking, which allows you to see immediate responses to updates and campaigns.
It also gives you clear information on where visitors spend time on your site and where they drop off.
Pricing
A self-hosted version is available for free. Multiple cloud-hosted plans are available, starting at $26/month for 50,000 hits in monthly traffic.
7. Mixpanel
Mixpanel tracks button clicks, form submissions, and navigation paths to provide detailed information on user behavior across your site.
The real-time data updates let you see up-to-date insights you can act on.
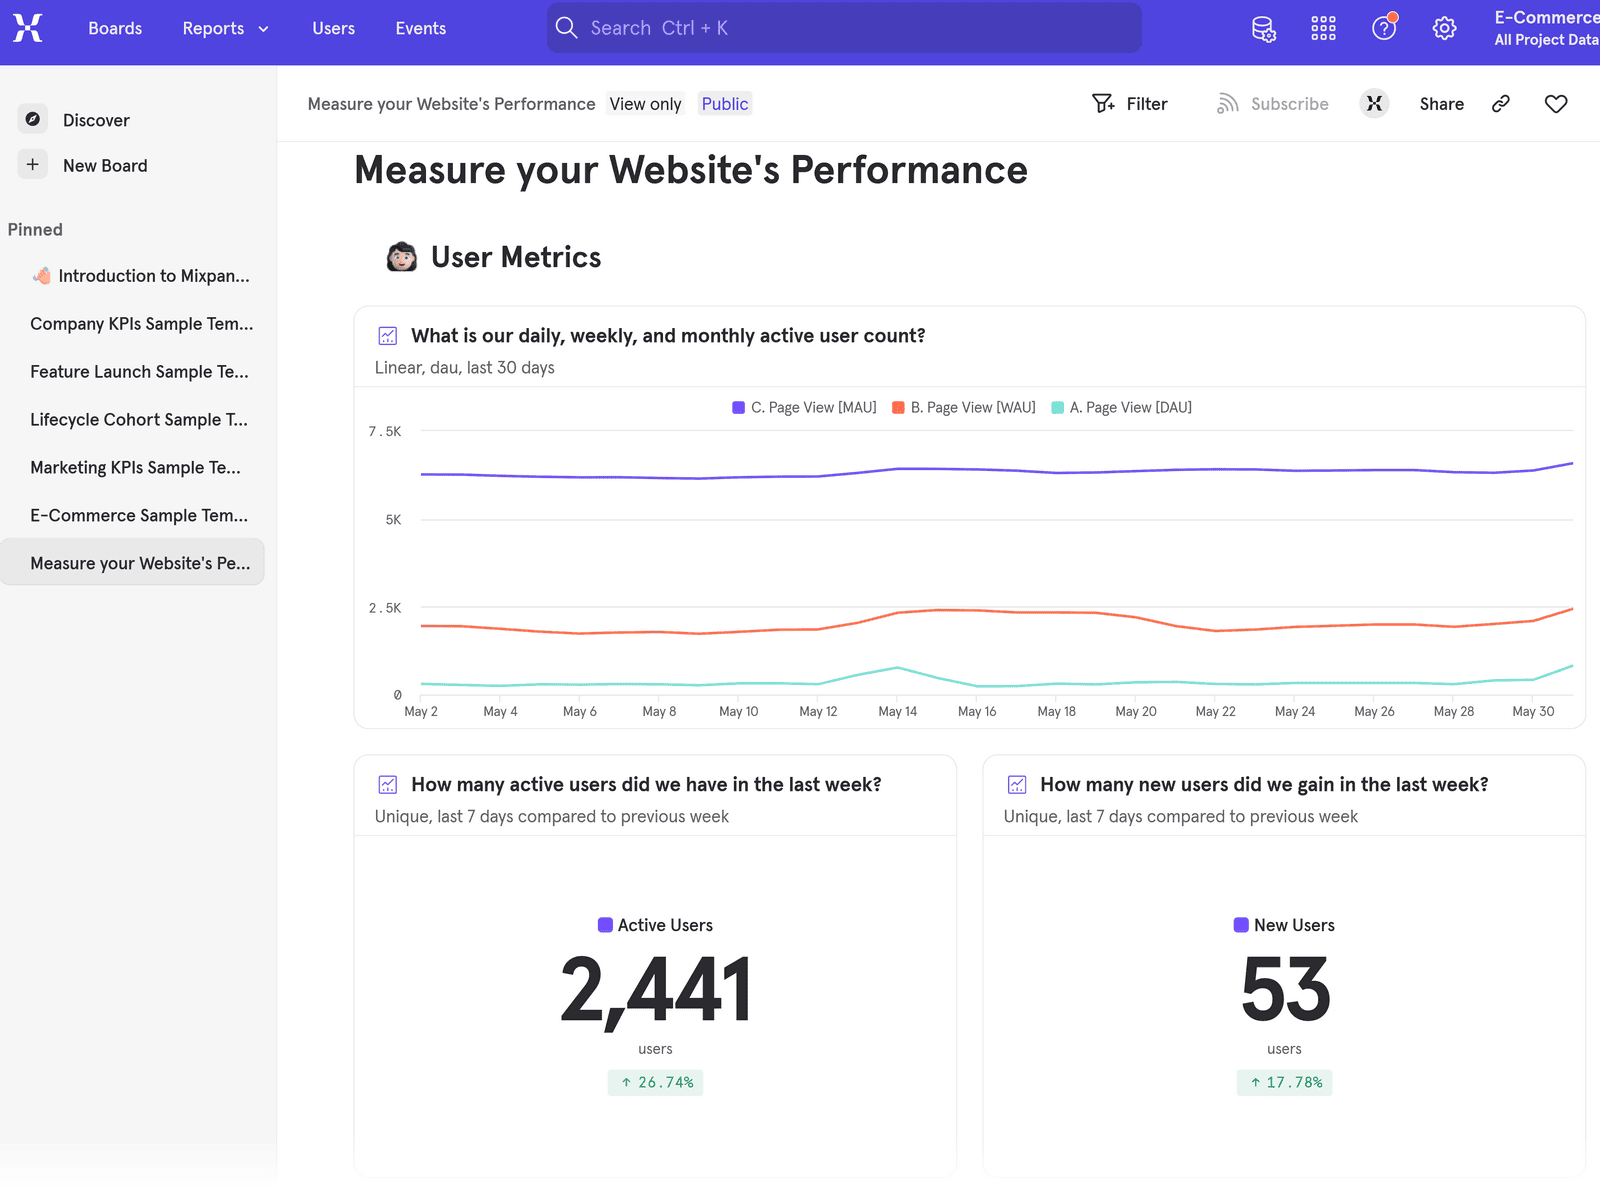
Mixpanel also offers:
- Funnel analysis: Track step-by-step actions of users to pinpoint drop-offs and optimize conversion paths
- Event tracking: Observe specific actions like clicks and form submissions to understand how users interact with your site
- A/B testing: Compare multiple versions of different pages to determine which elements perform better
What We Like
Mixpanel’s segmentation tools that allow you to analyze user behavior based on specific demographics and behaviors.
This makes it easier to tailor your website to align with the specific needs of different types of visitors.
Pricing
There’s a free plan with limited features. And there are two paid plans:
- Growth: $28/month for 10,000 events (price scales with events)
- Enterprise: Pricing available on request
8. Hotjar
Hotjar offers detailed insights into user behavior on websites through heatmaps and session recordings.
The tool helps identify usability issues that can be used to optimize webpages to improve user engagement and conversion rates.
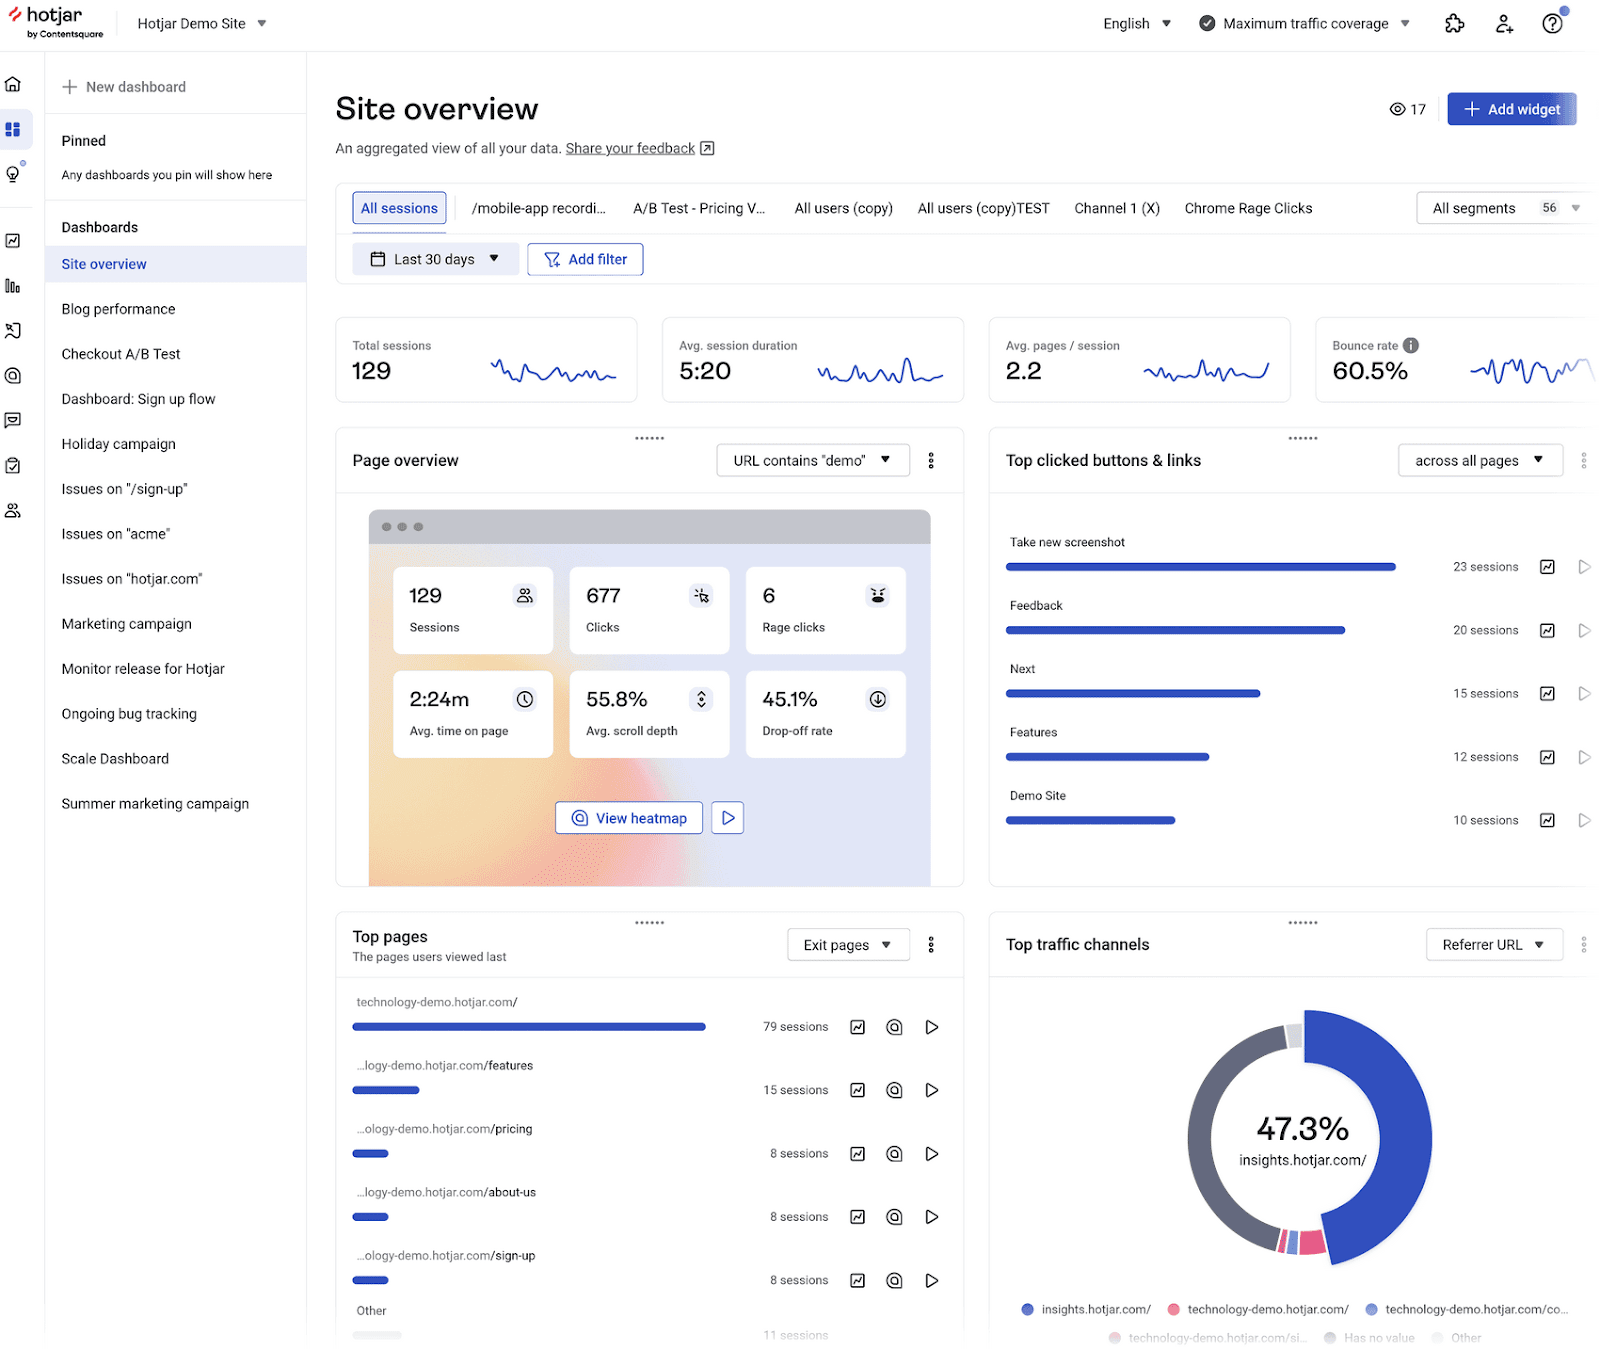
Hotjar also allows you to distribute surveys to collect feedback. And provides conversion funnel analysis capabilities.
What We Like
Hotjar's feedback widgets gather comments from your visitors, showing what they like or don’t like about your site.
This direct user feedback can help you make changes designed to increase the time people stay on your site and the number of pages they visit.
Pricing
A free plan with limited features is available. There are three paid plans:
- Plus: $39/month (track up to 100 daily sessions)
- Business: $99/month (track up to 500 daily sessions)
- Scale: $213/month (track up to 270K daily sessions)
9. Adobe Analytics
Adobe Analytics provides clear insights into your website’s traffic and user behaviors and is ideal for large enterprises. It also works well with other Adobe products.
You can see which areas of your site engage users the most. And make any needed adjustments.
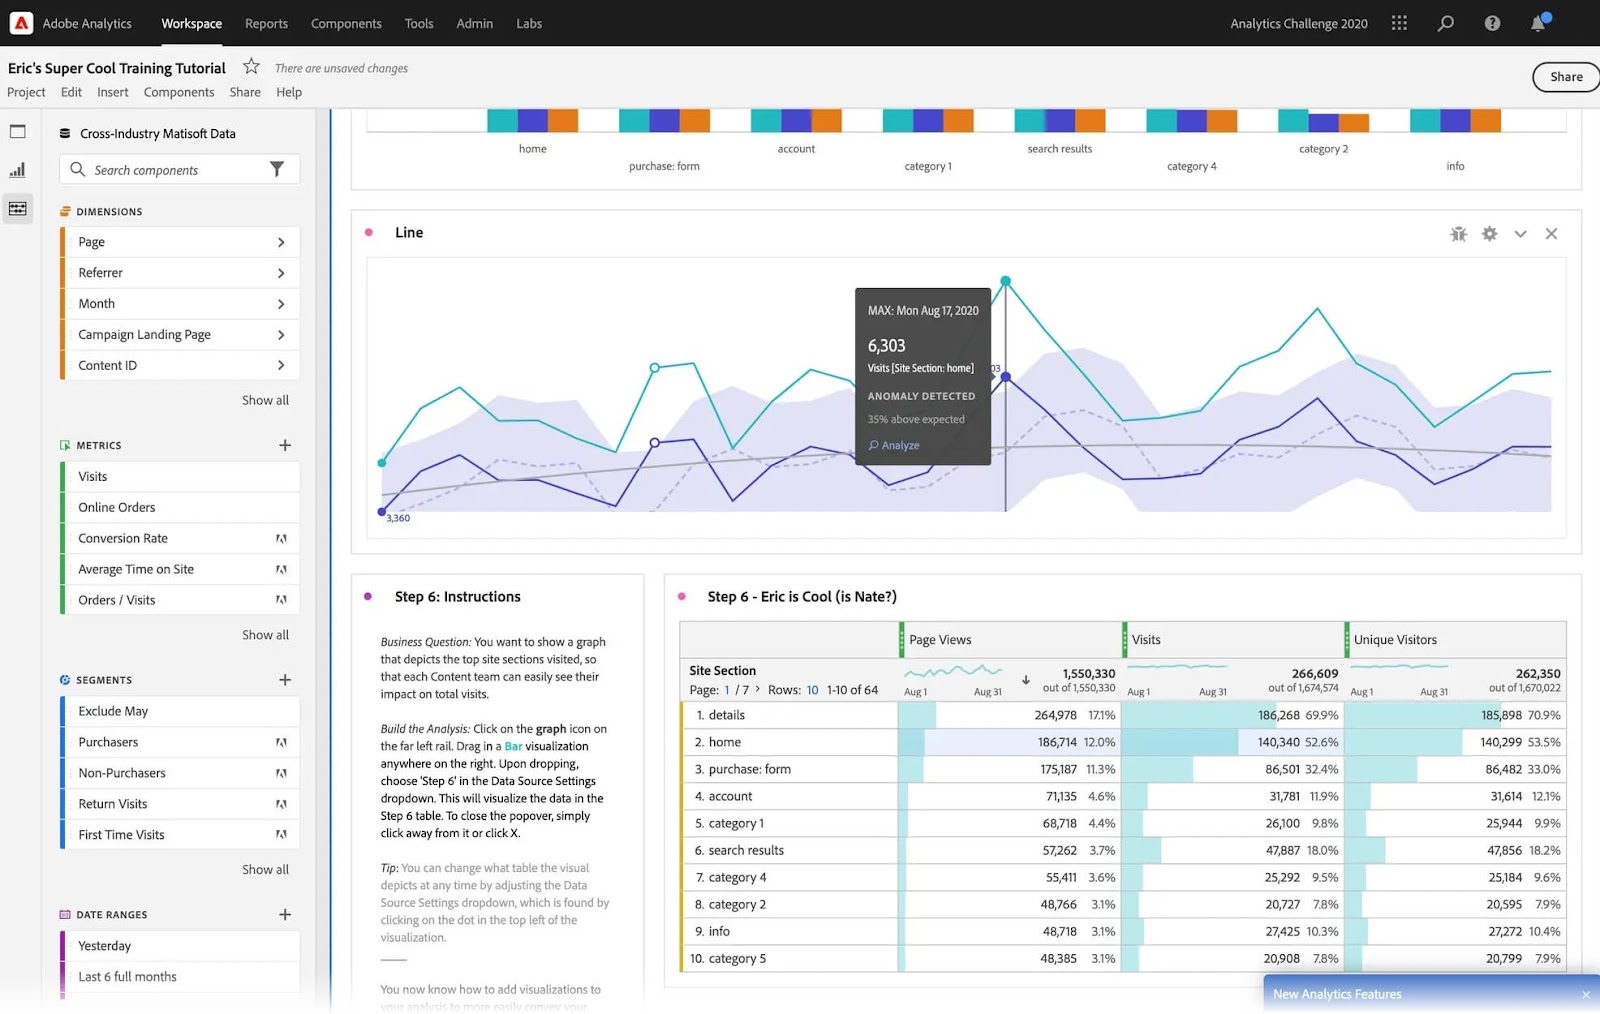
Image Source: Adobe
Like other tools on this list, Adobe Analytics lets you evaluate traffic sources, track conversions, and analyze user behavior.
What We Like
Adobe Analytics' predictive analytics helps you anticipate future trends by analyzing past user behaviors.
This helps you tailor your approach to take advantage of future opportunities.
Pricing
Adobe Analytics offers three packages: Select, Prime, and Ultimate. Contact them directly for a quote.
Choose the Right Tool for Your Site
Identify what features you want in your website traffic analysis tool. And what you want to achieve.
Then, choose the one that aligns with your needs and requirements.
With Semrush, you actually get two traffic analysis tools: Traffic Analytics and Organic Traffic Insights.
Try them both with a free Semrush account.