The Semrush Projects Dashboard provides you with small-scale widgets of data related to your current Projects. These widgets will provide you with a snapshot of some of the most important metrics associated with Semrush's tools.
There are three main ways to see a domain on your dashboard.
- Semrush Copilot is an AI-powered dashboard assistant that provides recommendations and alerts about your website’s SEO. In order to see Copilot in your dashboard, you need to first create a project.
- Create a Project to track various metrics about the site
- Add it to the Domains for monitoring section where it says “Add domain”


This quick guide will help you better understand what all of the metrics on the dashboard mean.
Project Widgets

- Site Health: (Site Audit) The health score of your Project’s latest audit
- Visibility: (Position Tracking) The visibility % that your main domain has for the target keywords in your Project
- Ideas to do: (On Page SEO Checker) The number of suggestions gathered by On Page SEO Checker that could improve your landing pages' rankings for the keywords in your Project.
- Toxic domains: (Backlink Audit) This is the number of toxic domains sending backlinks to your domain.
- Backlink prospects: (Link Building Tool) How many domains Semrush has found that could be targets of a link-building campaign for your site.
- Scheduled posts: (Social Poster) How many posts are scheduled in your queue.
- Organic sessions: (Organic Traffic Insights) The number of sessions that occurred on your Project domain for the past 7 days according to Google Analytics.
To return to the previous view, you can enable the “Table view” toggle:

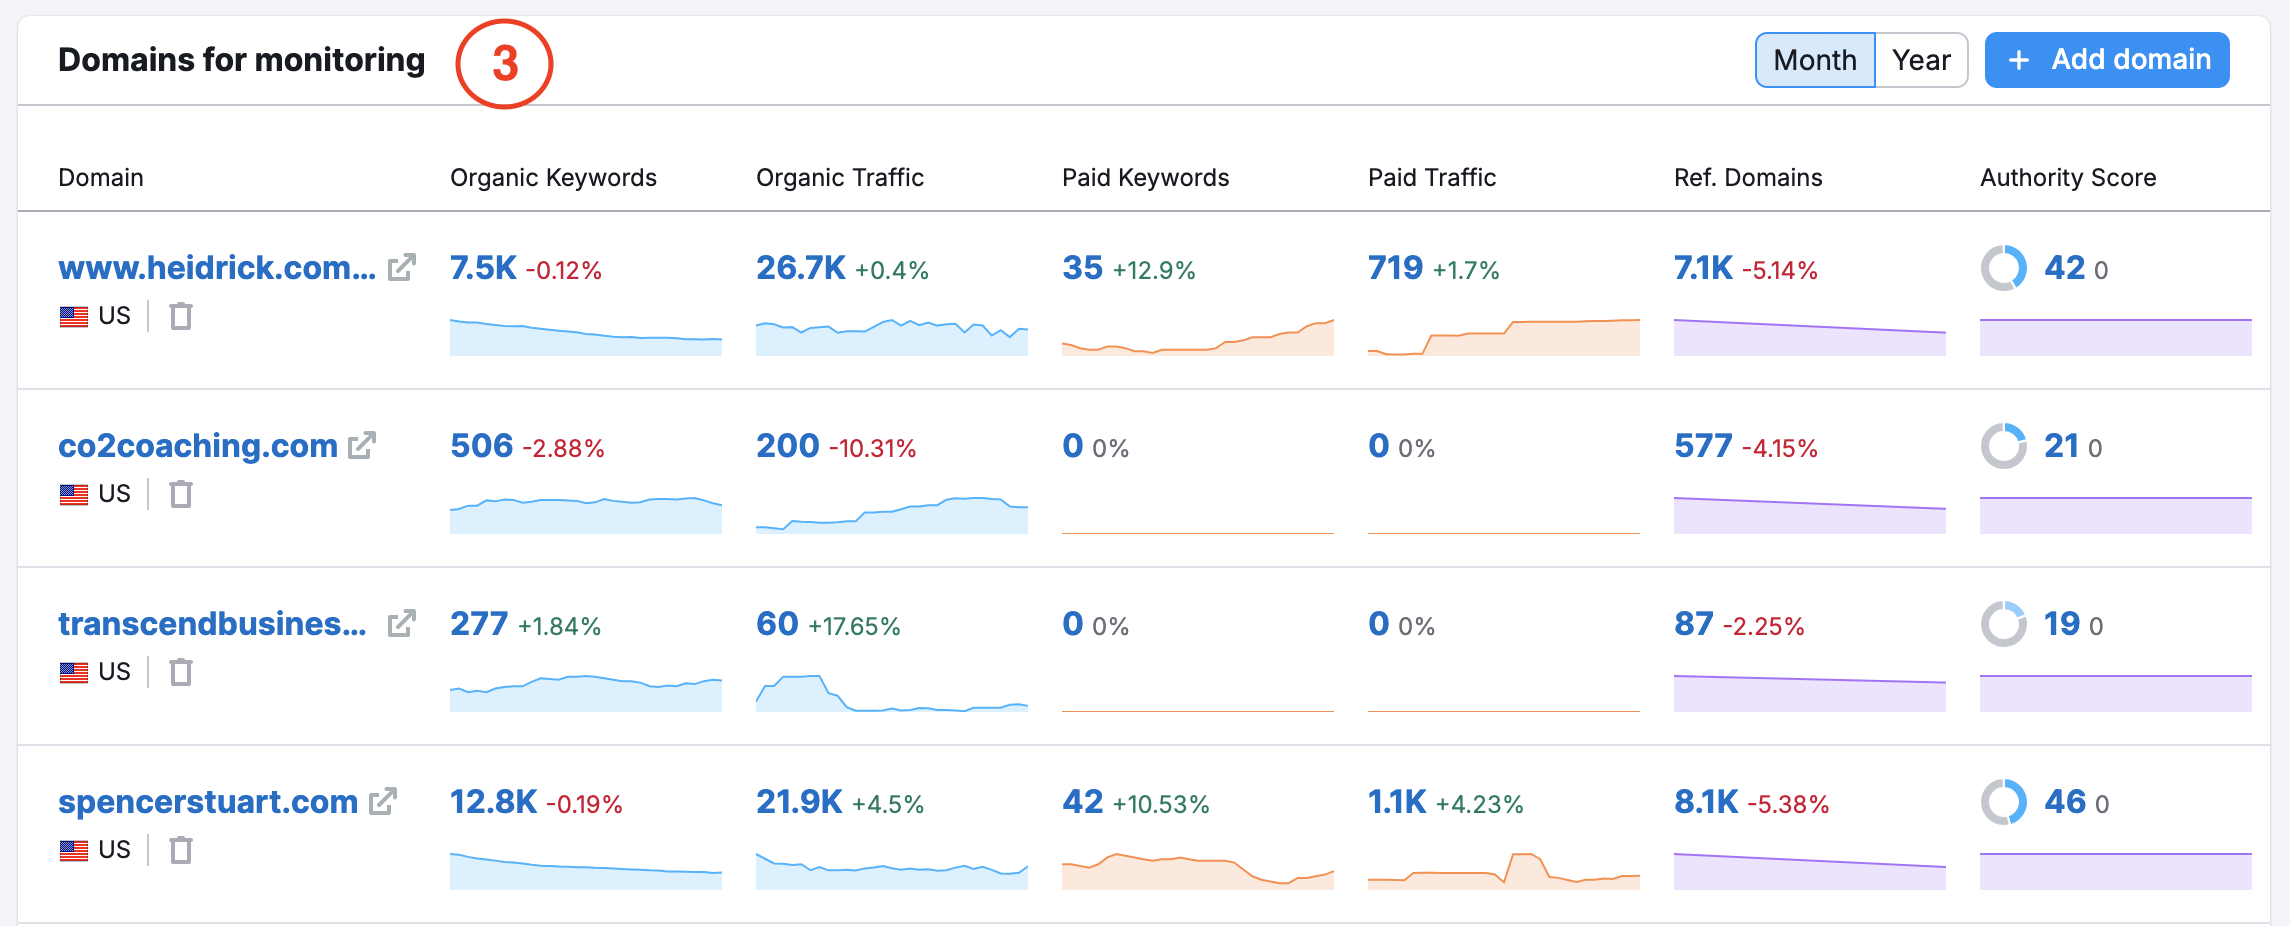
Domains for monitoring Domain Analytics metrics

- Organic Keywords: The number of keywords bringing users to the website via Google's top 100 organic search results.
- Organic Traffic: The number of users expected to visit the website in the following month or year on condition that average monthly organic traffic stays relatively the same.
- Paid Keywords: The number of keywords bringing users to the website via Google's paid search results.
- Paid Traffic: The number of users expected to visit the website in the following month or year on the condition that average monthly paid traffic stays relatively the same.
- Referring domains: The total number of referring domains that have at least one link pointing to an analyzed domain/URL.
- Authority Score: A metric used to gauge a domain’s overall quality and influence on SEO. The score is based on the domain’s backlink profile and traffic.
The percentages (%) below each number represent the domain's change in the respective metric when compared to the previous month or year (if you select “year” in the button above the widget). Click on any of these graphs to open up a deeper report.
The Domains for monitoring widget supports root domains, subdomains, and subfolders. The Organic/Paid traffic and Organic/Paid keywords metrics can be shown for a subdomain or subfolder. Referring Domains and Authority Score will be shown for the root domain.
All the metrics presented in the widget are Semrush data pulled from the following tools:
- Organic Keywords and Organic Traffic from the Organic Research tool,
- Paid Keywords and Paid Traffic from the Advertising Research tool,
- Referring domains and Authority Score from Backlink Analytics.
If you need to remove a domain from the Domains for monitoring widget, simply click the bin button under the domain’s address.
