AdClarity — Advertising Intelligence is a competitive intelligence app created by BIScience, which collects, analyzes, and aggregates real-time display, video, and social ad occurrences across 650,000 publishers from 51 global markets. Markets include the United States, Europe, Latin America, the Middle East, and Asia-Pacific. AdClarity — Advertising Intelligence can be found in the Semrush App Center.
How Can AdClarity — Advertising Intelligence Help Me?
AdClarity — Advertising Intelligence’s competitive advertising intelligence can help you:
- Analyze competitors’ digital campaigns
- Identify the best-performing publishers, advertisers, ad networks, and agencies
- Benchmark your online advertising against the competition
- Leverage data-driven insights to engage and deploy online campaigns more effectively
Pricing
AdClarity — Advertising Intelligence has the following subscription options:
- AdClarity Starter: $129 per month (available on a 7-day free trial)
- AdClarity Professional: $298 per month (available on a 7-day free trial)
- AdClarity Team: $349 per month
You can also make in-app purchases for additional markets for $69 each per month.
What Is Included in AdClarity — Advertising Intelligence
AdClarity — Advertising Intelligence analyzes expenditure, placement, buying methods, and more, for image ads, animated ads, rich media ads, skin ads, video, and social ads across 650,000 publishers in 51 global markets.
Your reports can be generated for Display, Video or Social alone or All Channels at once, depending on your subscription level. These can be done for Advertisers, Publishers, Campaigns and Keywords.
On a Professional plan, for instance, you can generate up to 100 reports and export up to 10 of them per month, whether they cover Display, Video, Social or all three.
- Argentina
- Australia
- Belgium
- Brazil
- Canada
- Denmark
- Finland
- France
- Germany
- Hong Kong
- India
- Indonesia
- Italy
- Japan
- Mexico
- Netherlands
- New Zealand
- Norway
- Philippines
- Puerto Rico
- Russia
- Singapore
- South Africa
- Spain
- Sweden
- Switzerland
- Taiwan
- United Kingdom
- United States
- Vietnam
- Argentina
- Australia
- Austria
- Belgium
- Brazil
- Canada
- Chile
- Colombia
- Czech Republic
- Denmark
- Egypt
- Finland
- France
- Germany
- Greece
- Hong Kong
- Hungary
- India
- Indonesia
- Ireland
- Israel
- Italy
- Japan
- Korea
- Kuwait
- Lithuania
- Malaysia
- Mexico
- Netherlands
- New Zealand
- Norway
- Philippines
- Poland
- Portugal
- Puerto Rico
- Qatar
- Romania
- Russian Federation
- Saudi Arabia
- Singapore
- South Africa
- Spain
- Sweden
- Switzerland
- Taiwan
- Thailand
- Turkey
- United Kingdom
- United States
- United Arab Emirates
- Vietnam
User Settings
In the bottom-left corner of the app interface, you’ll be able to access user settings.
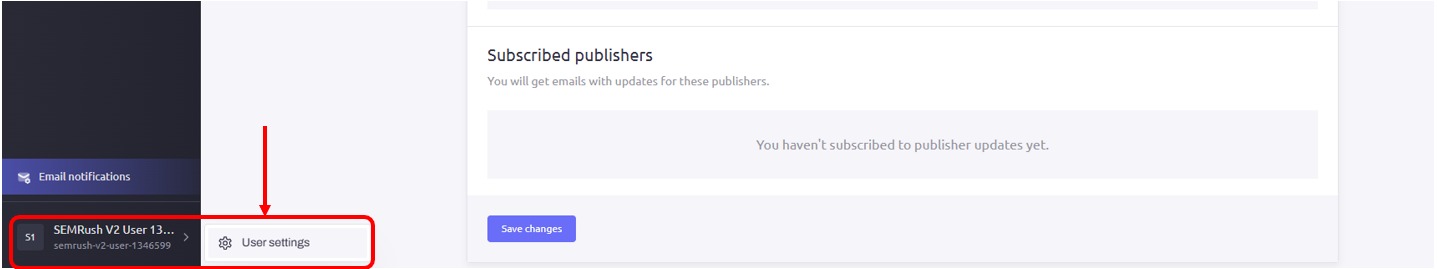
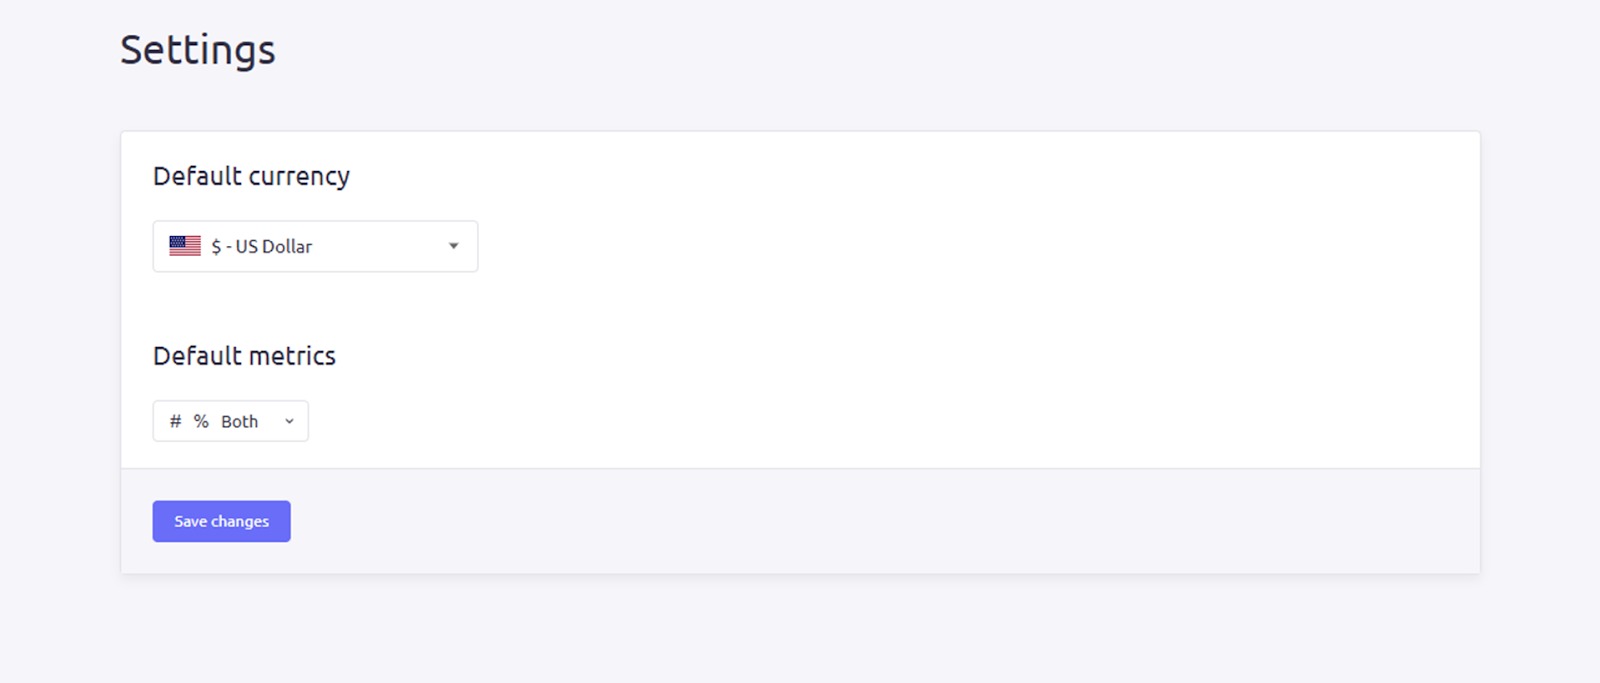
Here, you’ll be able to set up the following:
- Default currency - choose which currency is displayed in cost estimation widgets
- Default metrics - choose if you want related widgets to display numbers, percentages, or both.
Setting Up AdClarity — Advertising Intelligence
When you first open AdClarity — Advertising Intelligence, you’ll need to choose the market on which you want to base your report.
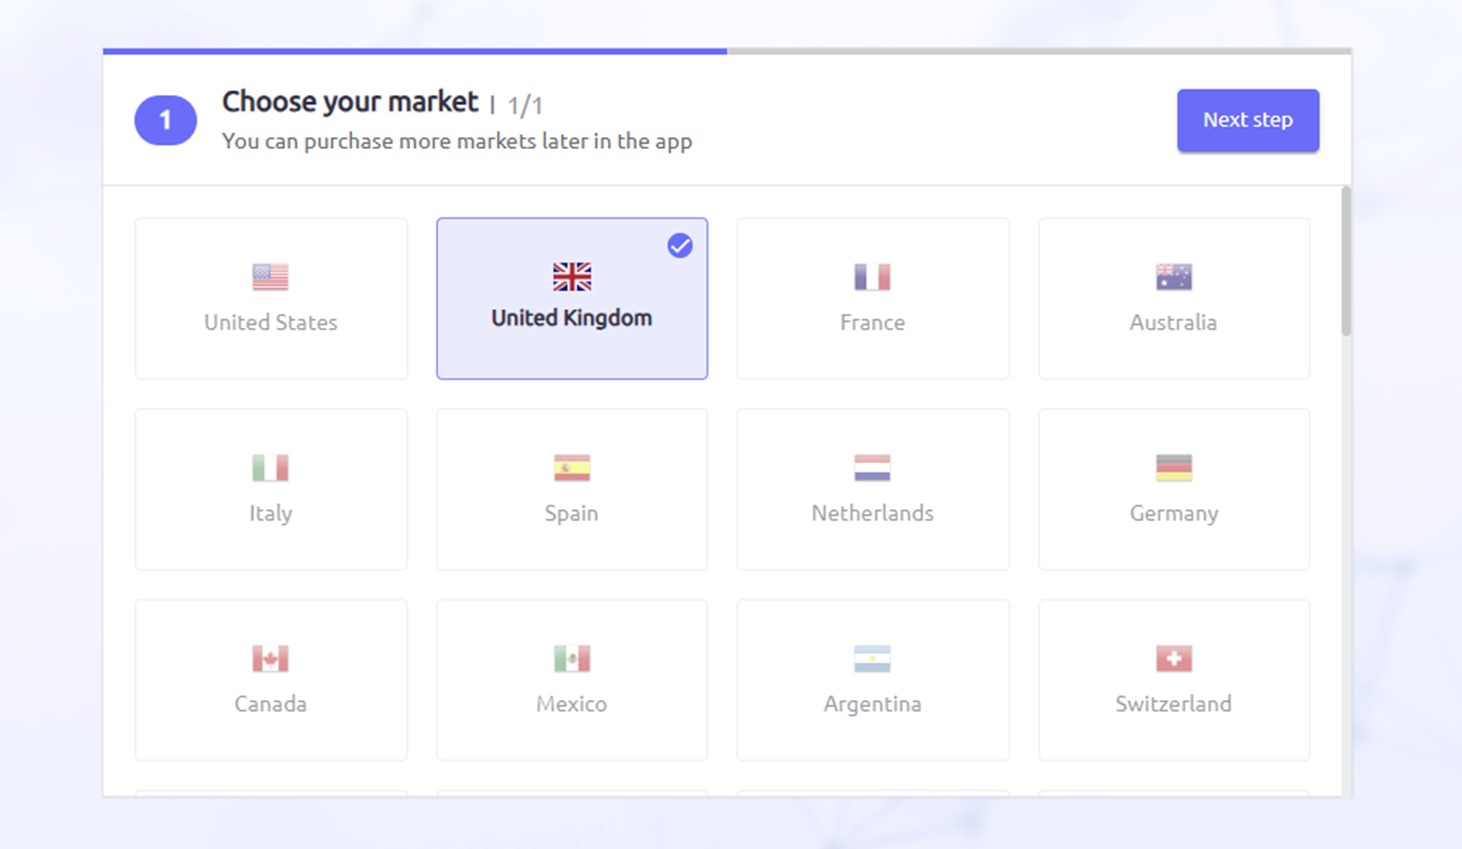
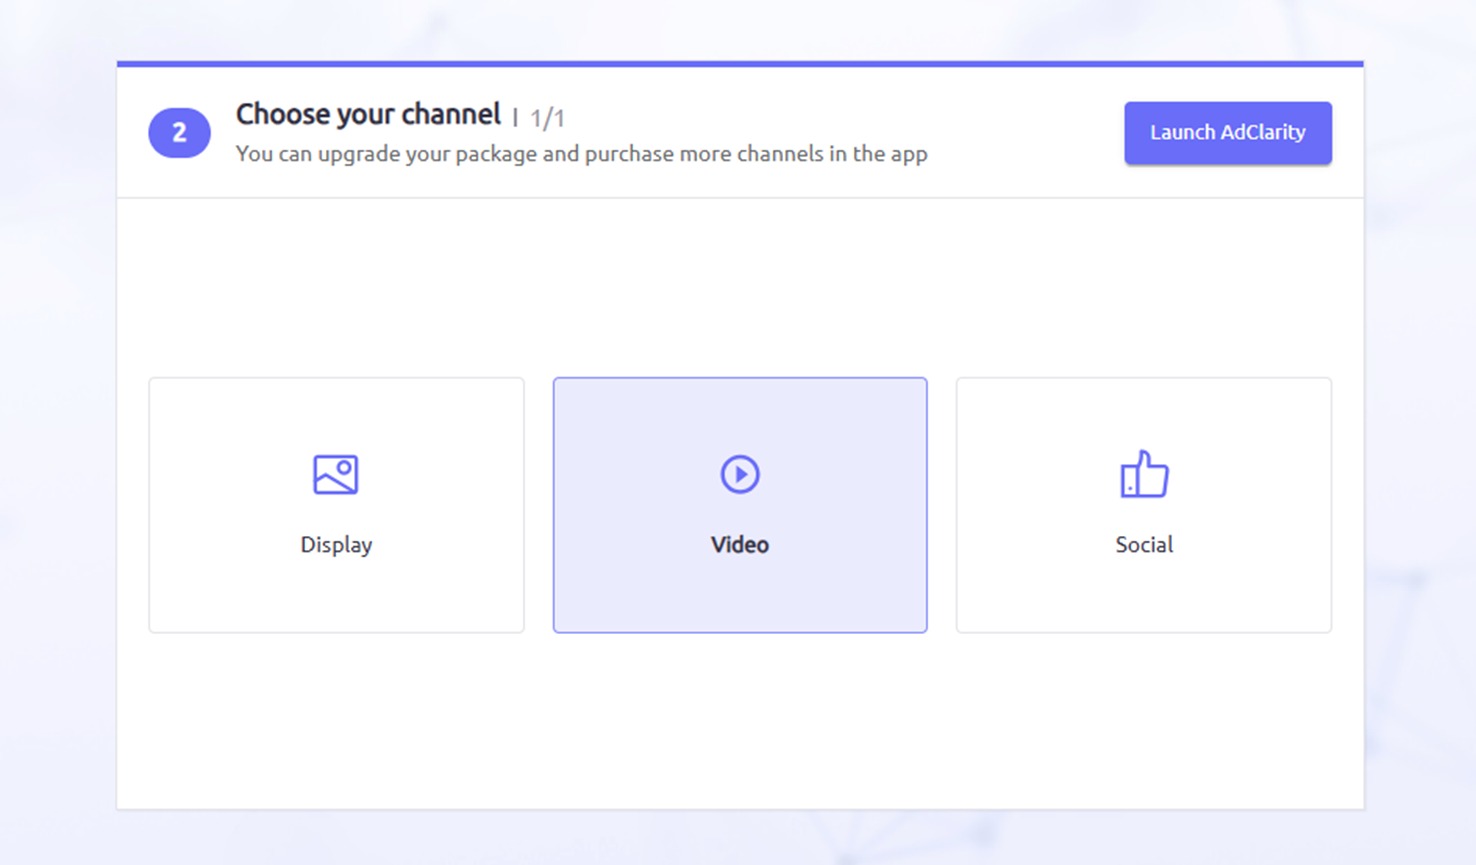
Make your selection and click ‘Next step’ to then choose your channel—pick Display, Video or Social and click ‘Launch AdClarity’ to get started.
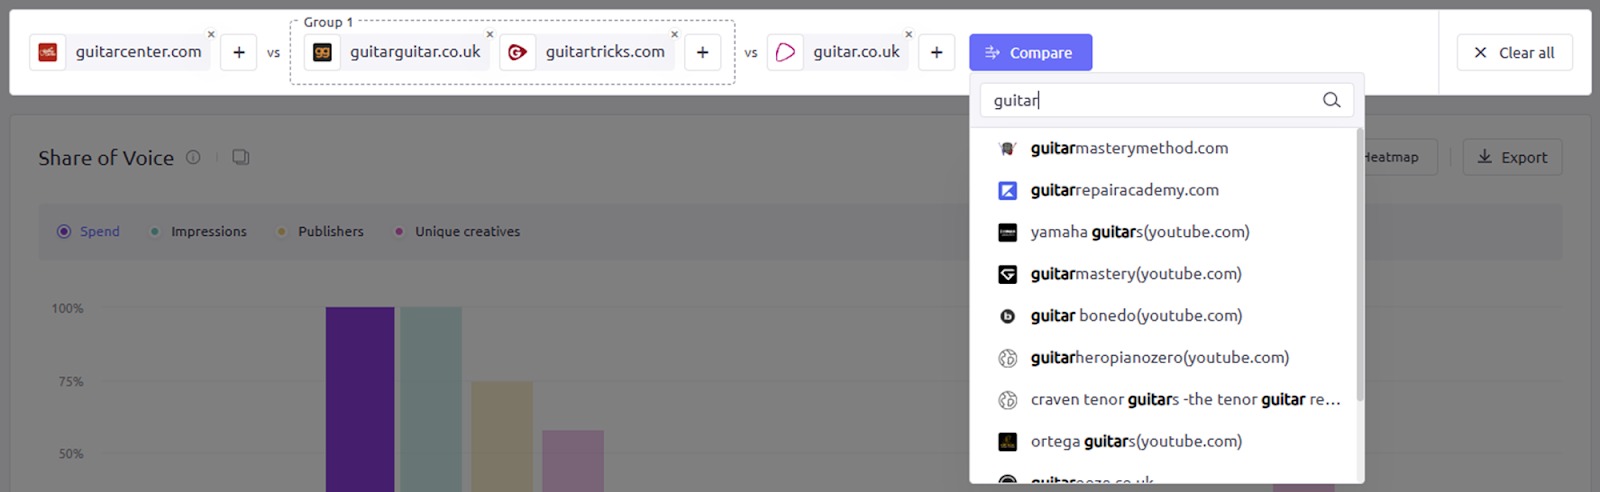
You can start setting up your report using the search bar at the top of the screen:
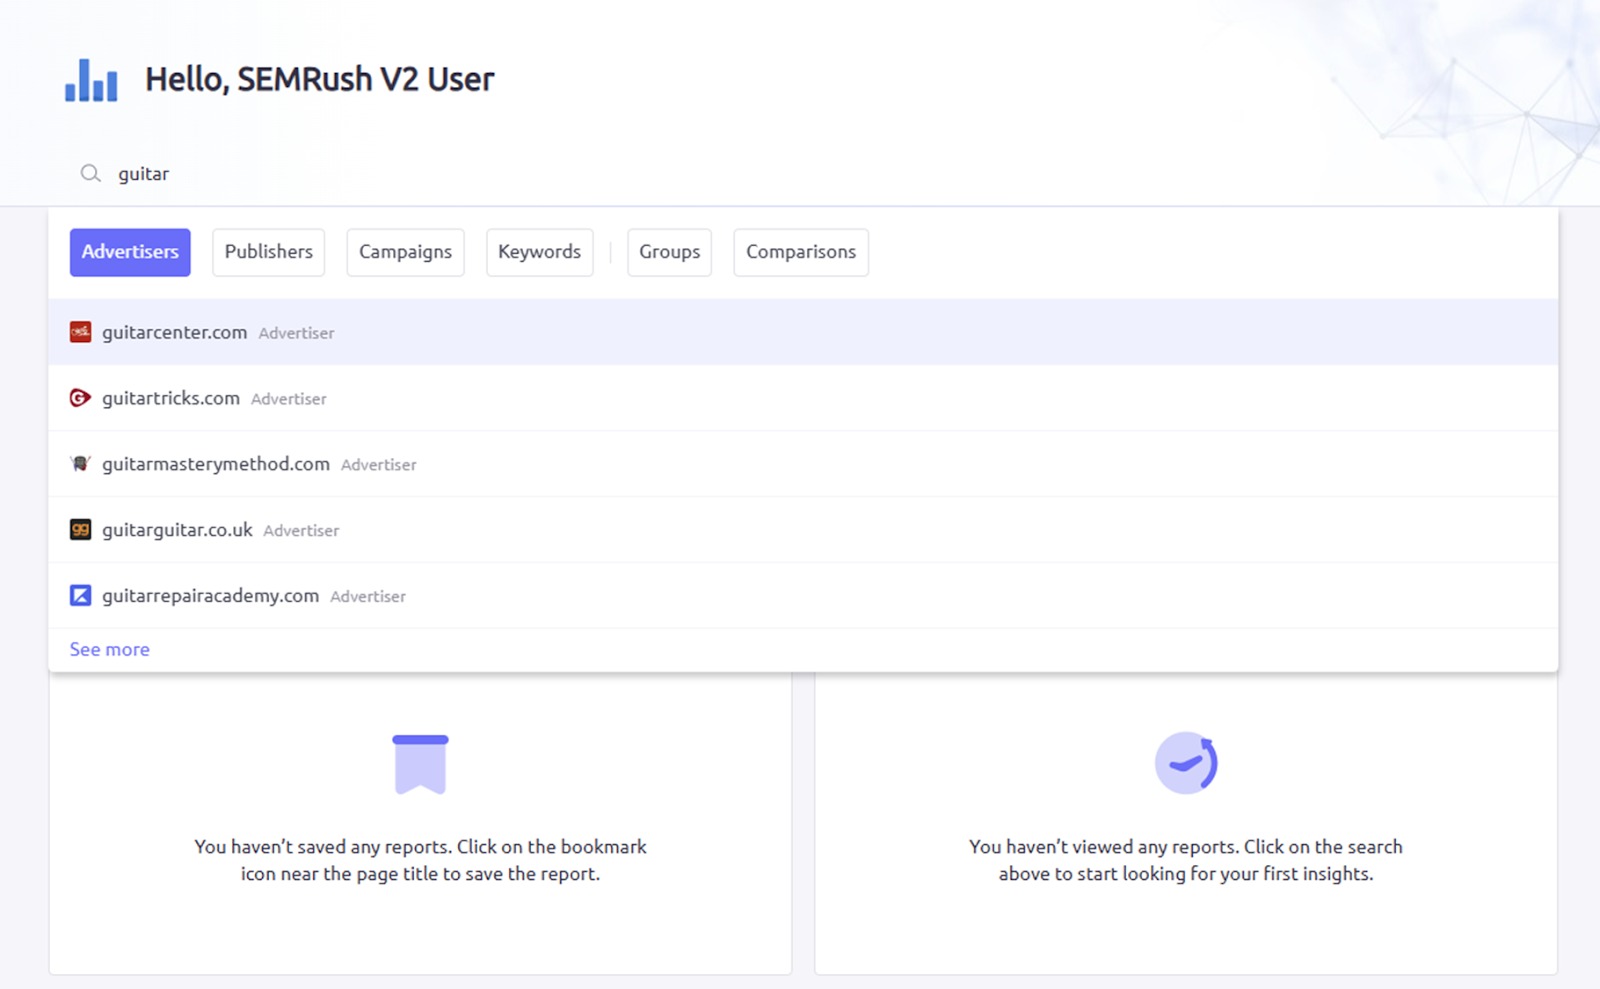
You can search for entities you’d like to analyze, including Advertisers, Publishers, Campaigns and Keywords (to search for multiple keywords, make sure they are separated by spaces).
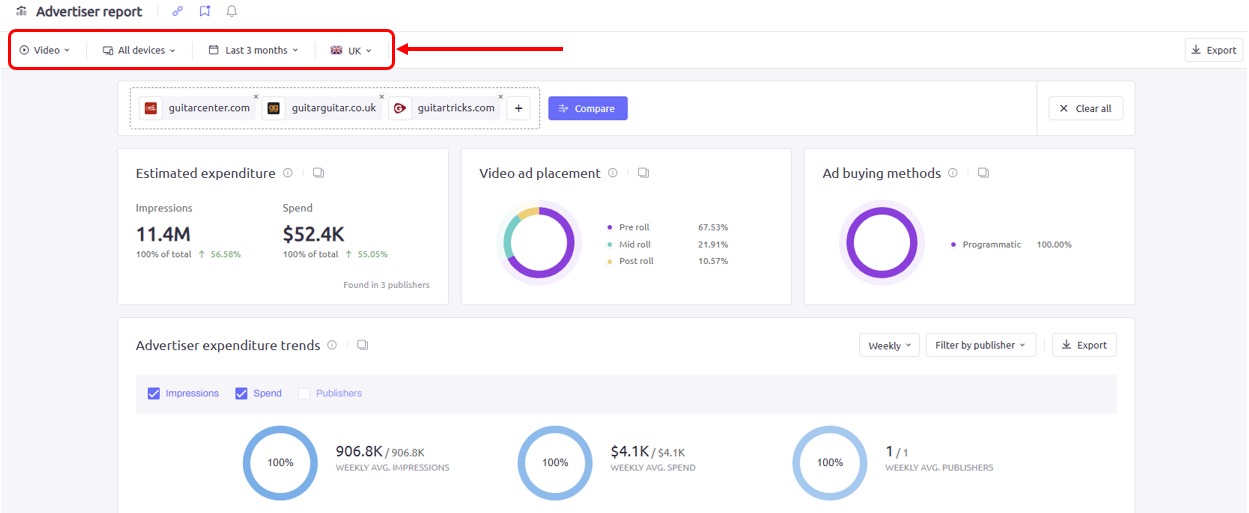
Click on the relevant results to add them until you are ready to ‘Submit’ to generate your report. Your results will then appear in a scrollable report, which will present the last three months of activity from your chosen entities. You can edit this timeframe, plus change your location, devices and, according to your subscription level, your channels, too, via the buttons at the top-left:
If you don’t see any results when using the search bar, double-check how you’ve typed the entity:
- semrush.com: This version is correct
- www.semrush.com: This version is incorrect
- https://www.semrush.com: This version is also incorrect
If you want to view more than one domain, you have two options:
- Group: View consolidated data for all of your selected domains
- Compare: Analyze up to 10 selected domains or groups against one another
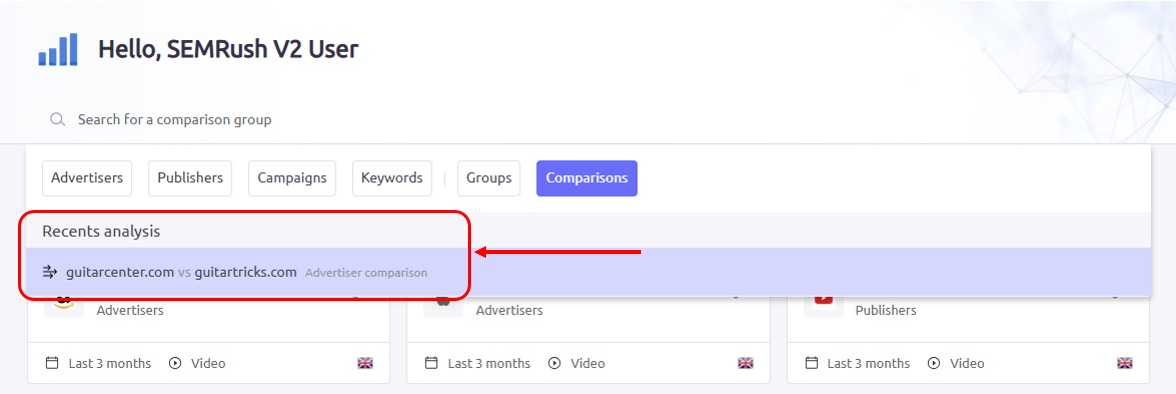
Groups and comparisons can be created by adding multiple results via the search bar in the first instance—they will appear as a ‘recent analysis’ under the search bar when you head back to the main page.
You can add to your comparison and compare single advertisers, for example, to groups of advertisers—simply click the ‘+’ icon to add to an entity and create a group.
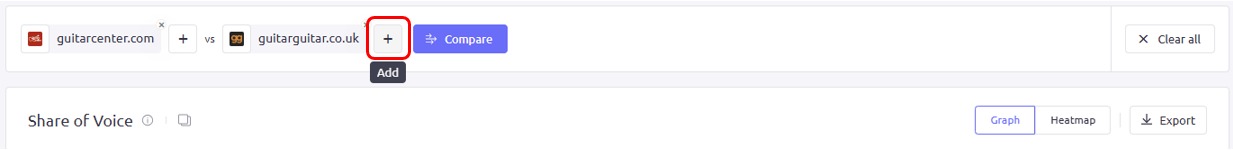
If you want to add another entity or group to compare, simply click the blue ‘Compare’ button and use the search function. You can edit the name of any group or remove it entirely by hovering over it.
Data saved as a group will be merged, whereas saving a comparison will maintain separate data for each domain.
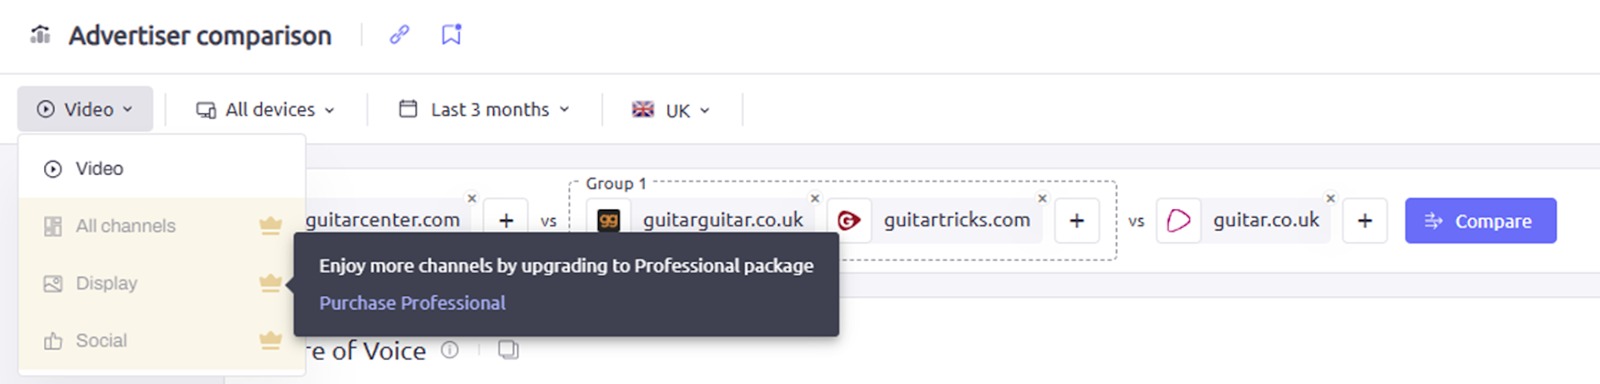
The aforementioned dropdown menu allows you to filter your report by the advertising channel you want to analyze, including:
- All channels
- Display
- Video
- Social
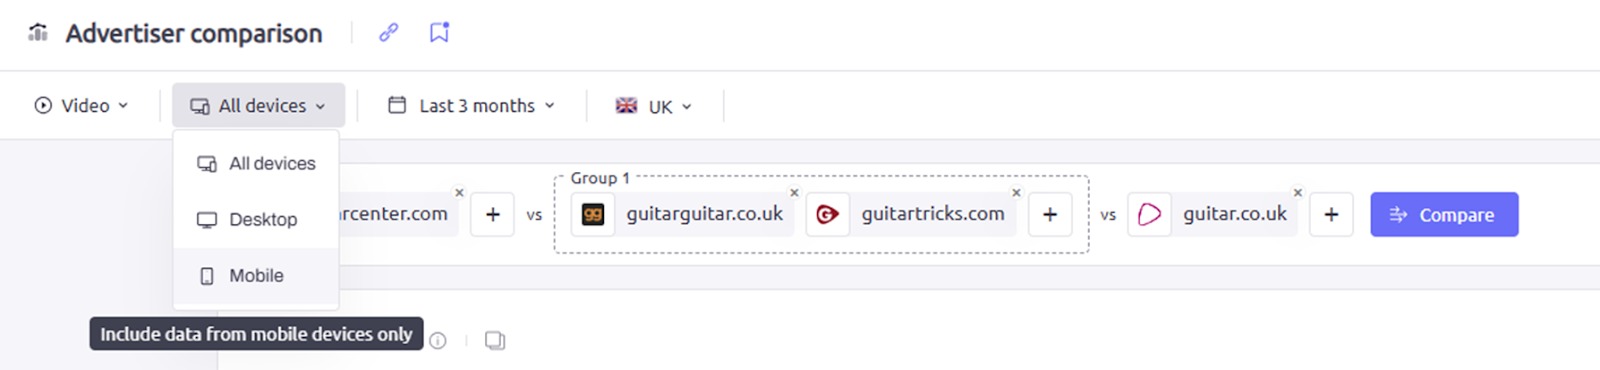
For display and video channels, you may also select a device type:
- All devices: Analyzing all instances of display ads regardless of device type
- Desktop: Analyzing only ads that appeared on desktop browsing
- Mobile: Analyzing only ads that appeared on mobile devices and browsers
Next, you can choose to view data from periods including the last seven days, 30 days, three months, 12 months (requires Team subscription), or the current year to date.
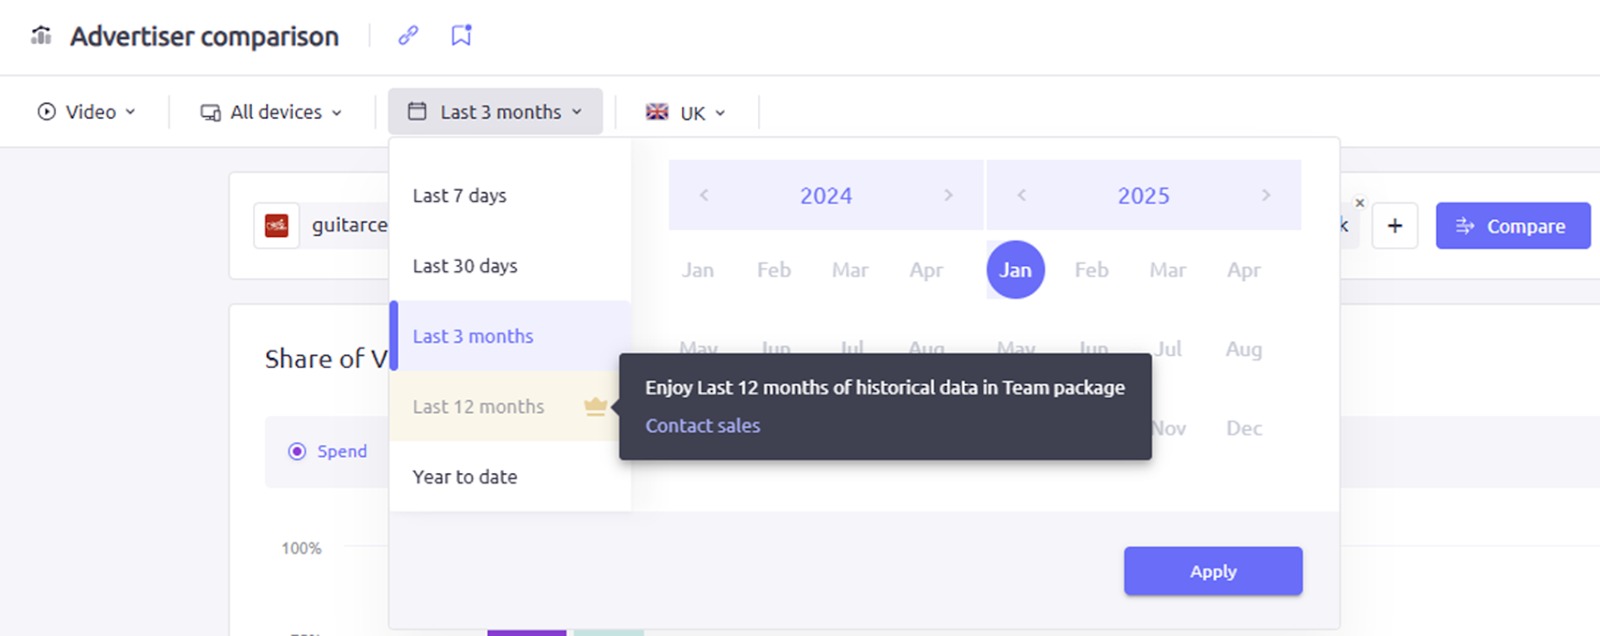
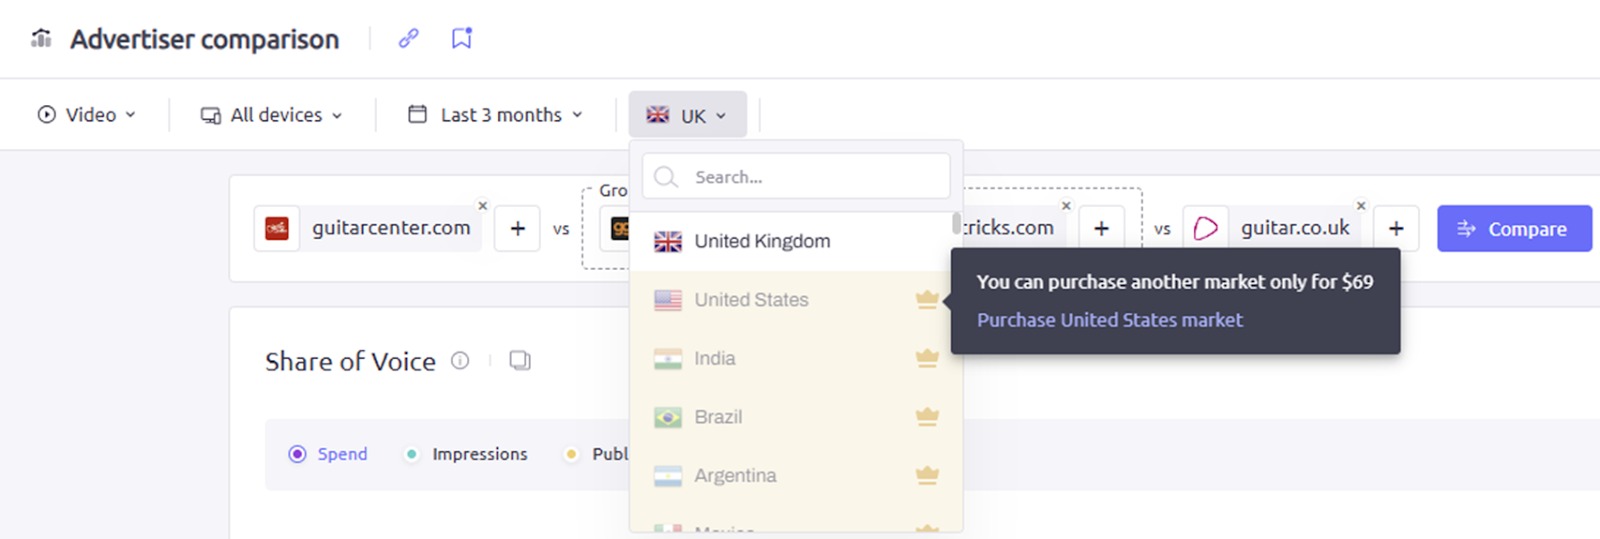
You may also customize your view by country—click the dropdown arrow to pick your geolocation. Additional markets can be purchased for $69 per month, but some countries may be unavailable, depending on the domain being analyzed.
Exporting Your Report
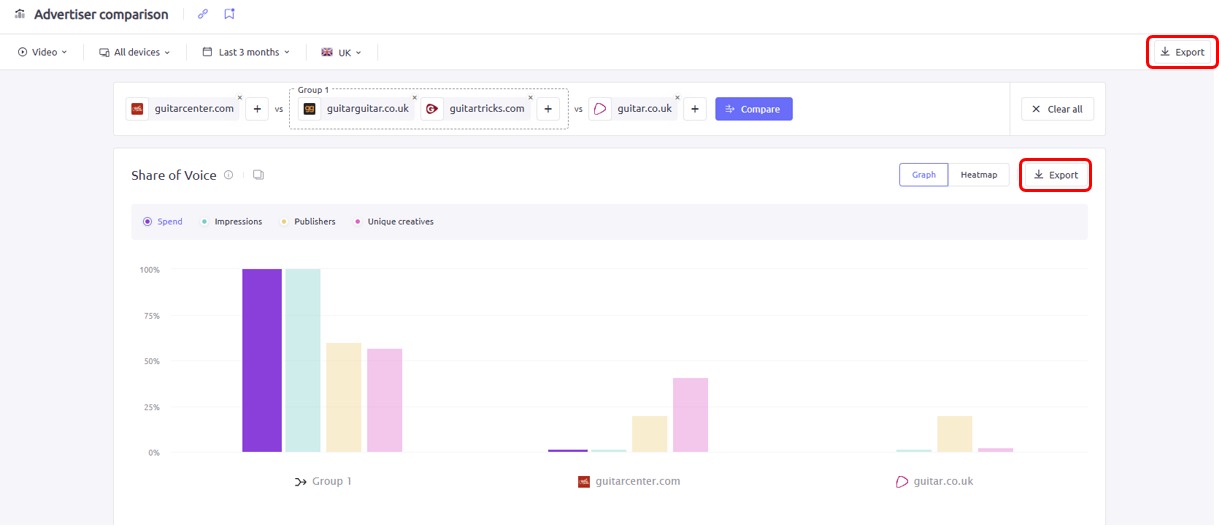
To export your report or even individual sections of it, click on the ‘Export’ button in the top-right.
Next, select the file type you want to export:
- PDF: Exports all charts and graphs as displayed in the app (unlimited)
- Excel: Exports a spreadsheet containing the data shown in the report (subject to monthly limits, depending on your subscription)
Report Types
AdClarity — Advertising Intelligence offers four different report types:
- Publisher reports
- Advertiser reports
- Campaign reports
- Keywords reports
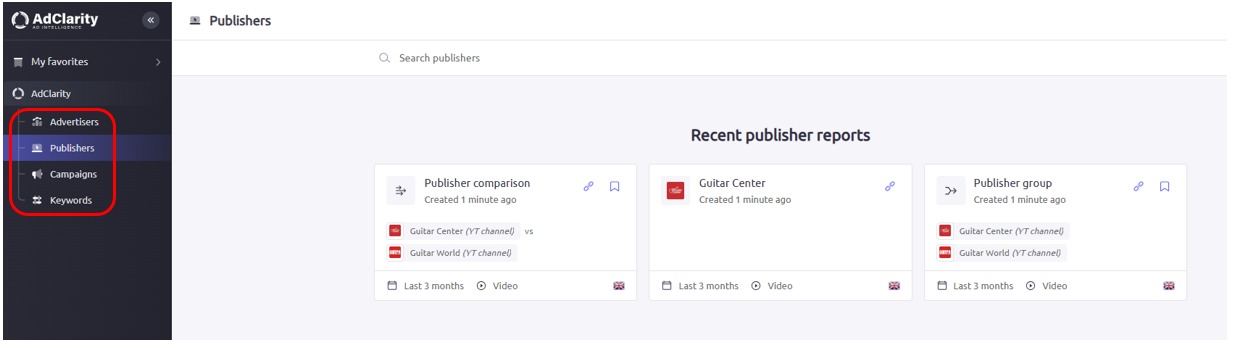
Any recent reports you have generated will be listed within the relevant tab, accessible via the left-hand menu.
Additionally, users can compare publishers and advertisers against one another, and create groups to consolidate data.
Each report shares many of the same widgets, while analyzing different sets of data.
Publisher vs. Advertiser Reports
The Publisher report analyzes the placement and performance of ads published on a specified domain or app, and compares the performance of ads published on multiple specified publisher domains. As such, this report will provide data about the ads and advertisers published on the domains in question. “Publisher” here refers to a domain or app that displays an ad for a third party (the advertiser).
Meanwhile, the Advertiser report analyzes the performance of a specified advertiser’s ad placement across all publishers, and compares the performance of multiple advertisers across all publishers. As such, many of the widgets in this report contain information about publisher performance with respect to the advertisers in question. Here, “Advertiser” refers to any organization whose ads are being displayed on third-party “publisher” domains.
Campaign Reports
Campaign reports analyze the performance of a specific campaign. A campaign is a group of coordinated ads all leading to the same landing page. You can head to the campaign landing page by clicking the right-hand icon beside the title (the link icon will allow you to copy the link to the report for sharing).
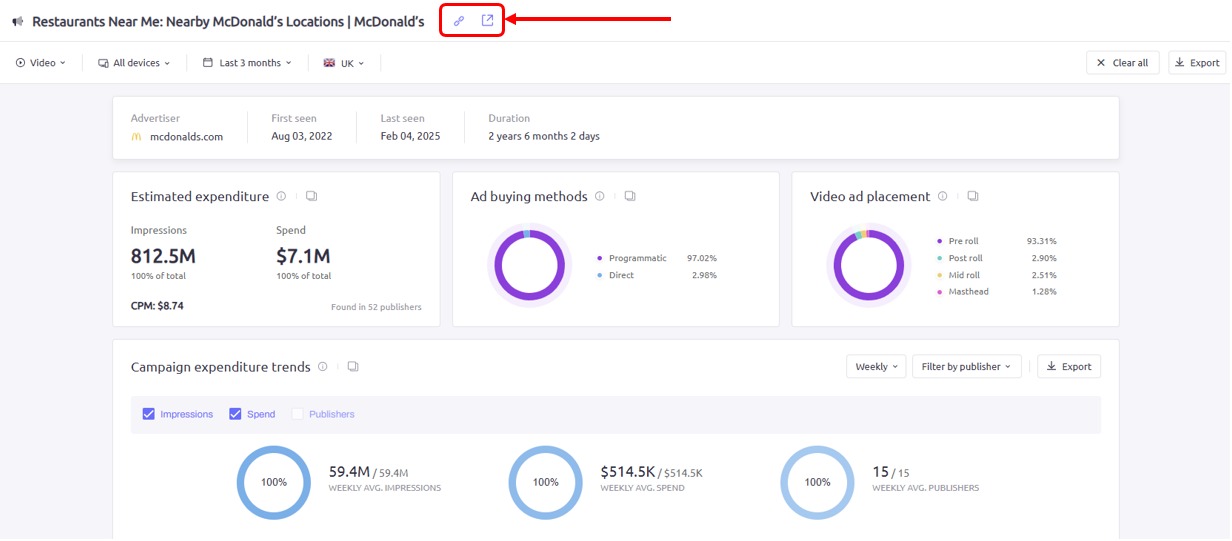
In the campaign report header, you can find:
- The advertiser running the campaign
- The ‘First seen’ and ‘Last seen’ dates
- The campaign duration
The body of the report uses the same widgets described below in the Widgets Guide section. The chief difference is that, in this report, the widgets use data only on this specific set of ads.
Keywords Report
The Keywords report analyzes campaigns based on specific search terms. In this report, you will find:
- The number of campaigns
- The Top Ads

Single Domain vs. Multiple Domain Comparison Mode
The widgets that appear in your report may vary, depending on:
- Whether you’re viewing a single domain or comparing several
- Which advertising channels you’re viewing
- Whether you’re viewing an advertiser or publisher
Here is a breakdown of which widgets you can expect to find:
|
Single Domain Report |
Multiple Domain Comparison Report |
Widgets Guide
Below is a guide to all of the widgets you can expect to find in the AdClarity — Advertising Intelligence app. Please note that not all widgets will appear in every view. See the Single Domain vs. Multiple Domain Comparison chart above for a complete breakdown.
Estimated Expenditure
The Estimated Expenditure widget appears at the top-left of both publisher and advertiser reports when you are analyzing a single domain or group. If you’re comparing multiple domains, you will instead see the Publisher or Advertiser Distribution widget.
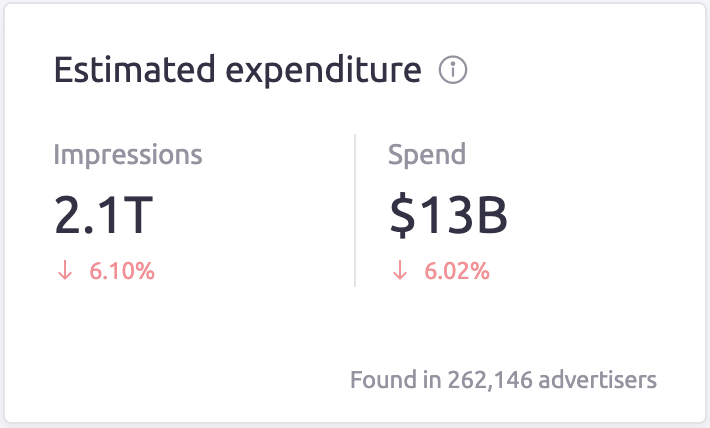
In an advertiser report, Estimated Expenditure shows the total impressions (on the left) and ad spend (on the right) across all publishers.
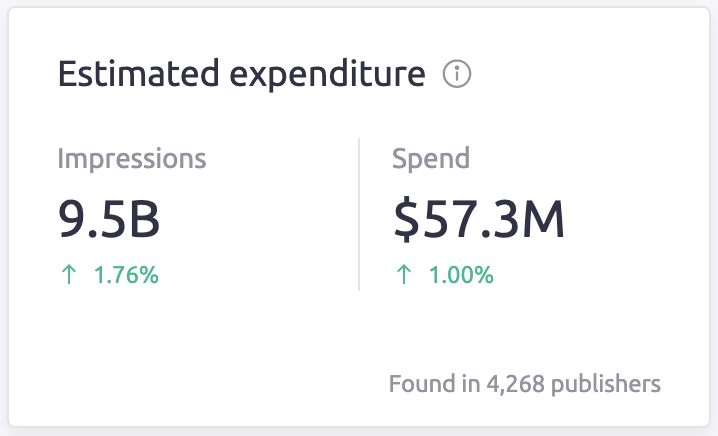
If you are viewing all channels, the widget appears as shown above. If you are only viewing a single channel (e.g. display ads), the widget will also show you that channel’s share of impressions and spend.
Please note that these figures are determined by your selected channel, domains, device type, period, and country. Any updates to these selections will change the estimated expenditure.
The number of publishers contributing to these estimates can be found in the bottom right corner of the widget. If you click on this number, you’ll be taken down the page to the Top Publishers widget for a more detailed breakdown.
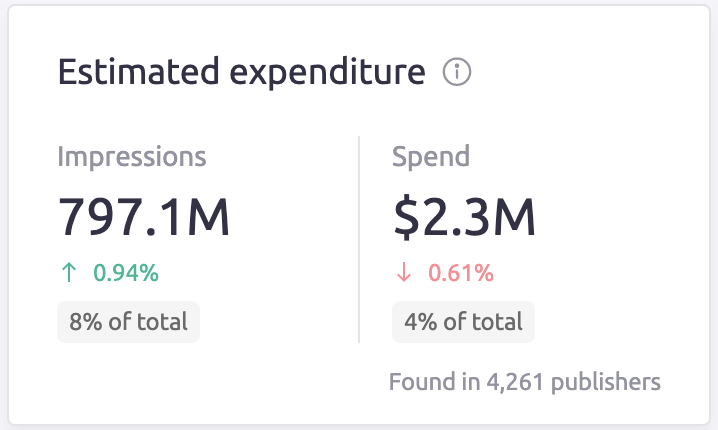
Here is an example of what this widget looks like when viewing a publisher:
For publisher domains, Estimated Expenditure shows the total impressions generated by all ads placed on that domain. Ad spend refers to the amount spent by advertisers to buy ad placements on the relevant publisher domain. Clicking the ‘Found in # advertisers’ link will take you to the Top Advertisers widget.
If you select a period of two months or more, the widget also displays a Month-on-Month change (MoM change) metric below the total impressions and ad spend figures. This metric is great for checking recent impressions and ad spend trends at a glance.
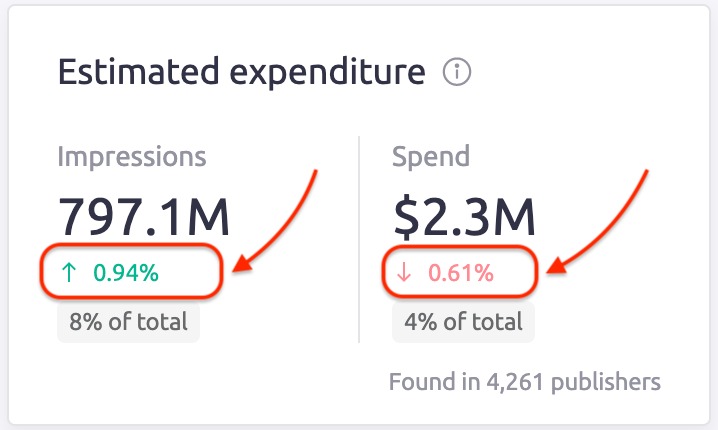
If there was a decline in estimated impressions or expenditure compared to the previous month, the change would be displayed in red with an arrow pointing down, and if there was an increase, the number would be displayed in green with the arrow pointing up.
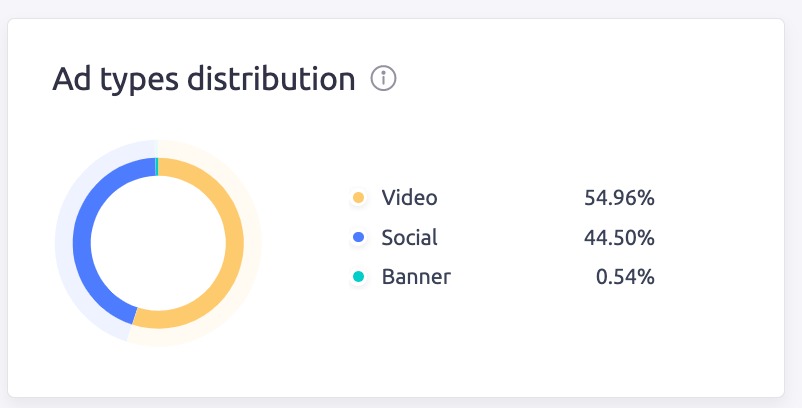
Ad Types Distribution
The Ad Types Distribution widget appears when you analyze a single advertiser domain for the following channels:
- All channels
- Social
This widget shows how many of each type of ads an advertiser runs during the analyzed period.
When viewing all channels, that includes video, banner, and social ads.
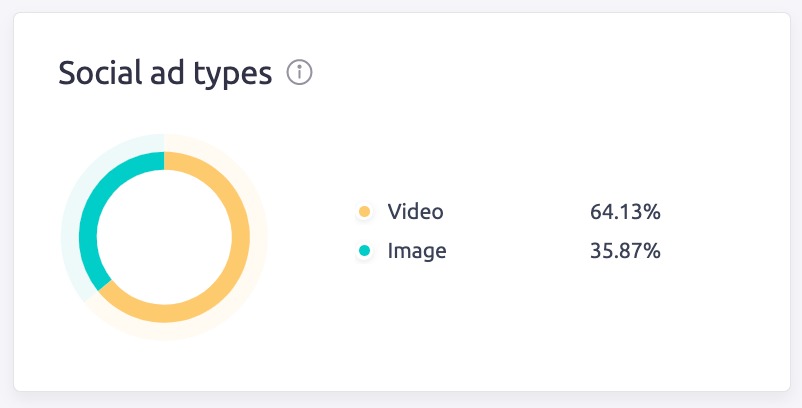
When viewing the social channel, this widget is called Social Ad Types, and includes:
- Image ads
- Video ads
- Carousel ads
- Promoted accounts
Ad Placement
The Ad Placement widget appears when you analyze a single domain for the following channels:
- Display (called Display Ad Placement)
- Video (called Video Ad Placement)
- Social (called Social Ad Placements)
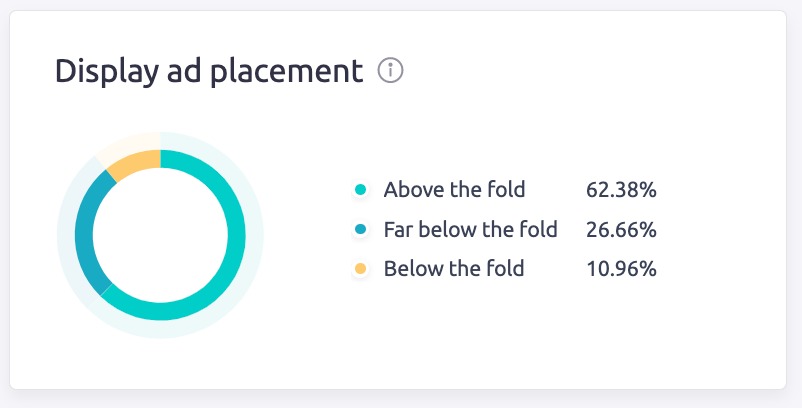
Display Ad Placement analyzes where display ads were placed on the screen when they occurred. Options include:
- Above the fold: Ads visible on a user’s screen without scrolling
- Below the fold: Ads visible on a user’s screen after scrolling
- Far below the fold: Ads placed at or near the bottom of the page
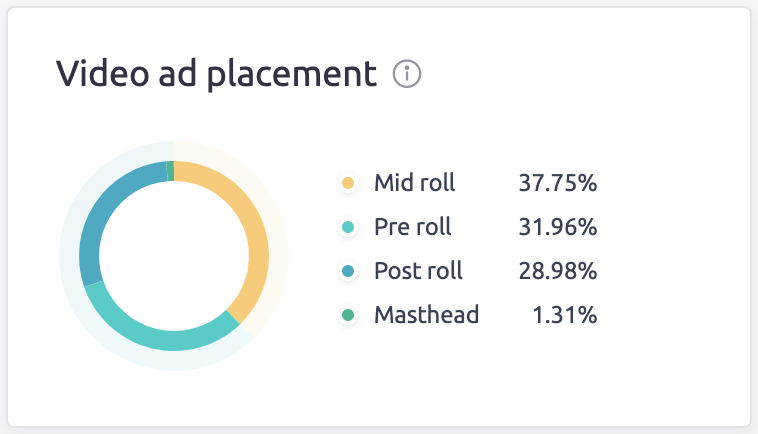
Video Ad Placement shows you where in a video the ad appears:
- Pre-roll: Before a video begins
- Mid-roll: During a video
- Post-roll: At the end of a video
- Masthead: On top of a video page
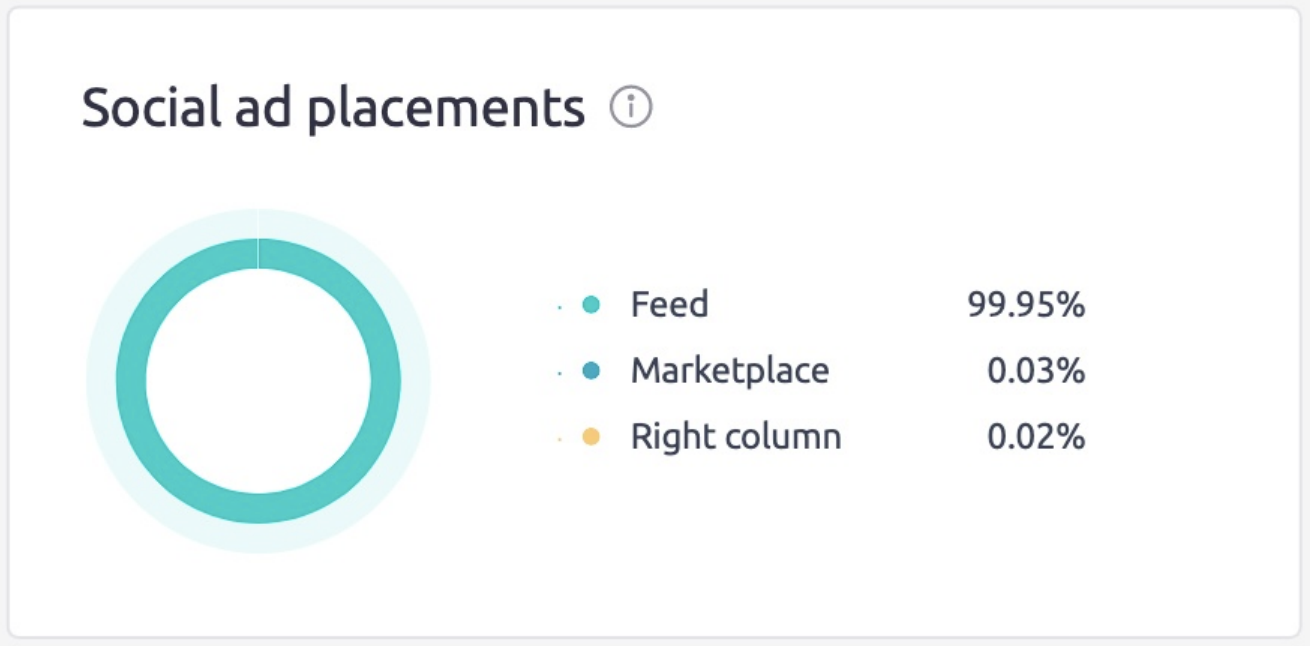
The Social Ad Placements widget shows where on a social platform an ad was placed (e.g. in the feed, in a column to the right, or in the marketplace). As such, the options included may vary depending on the social platforms used and the available data for those ads.
This widget’s functionality is essentially the same for both publishers and advertisers, though it analyzes slightly different data:
- Advertiser view: Breaks down the placement of the selected advertisers’ display ads across many publishers
- Publisher view: Breaks down the placement of ads from many advertisers on selected publisher domains
Ad Buying Methods
When analyzing a single domain, Ad Buying Methods appears to the right of the Ad Placement widget, for the following channels:
- All channels
- Display
- Video
This widget shows a high-level overview of ad buying methods during the analyzed period. Buying methods are broken down into three categories:
- Ad Network: Ads that were bought via an Ad Network (such as Google Display Network) to be displayed on a variety of publisher domains
- Programmatic: Ads that were purchased using an automated system, usually through an ad exchange
- Direct: Ads that were bought directly through the publisher
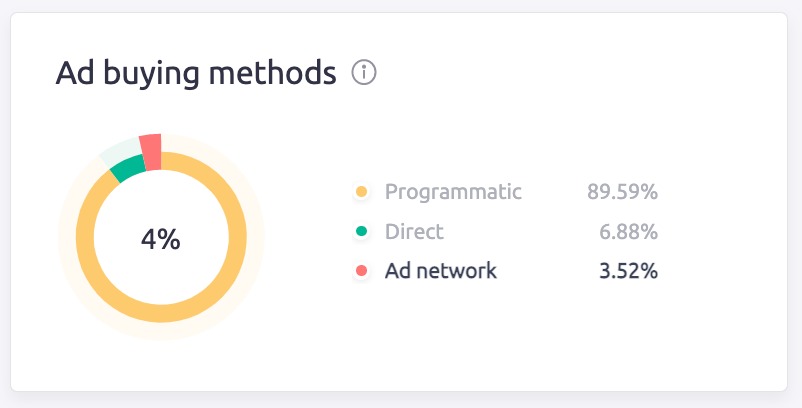
When viewing an advertiser, this widget analyzes all of the analyzed advertiser’s ads across all publishers. When viewing a publisher, it analyzes all ads displayed on the publisher domain from all advertisers.
Share of Voice
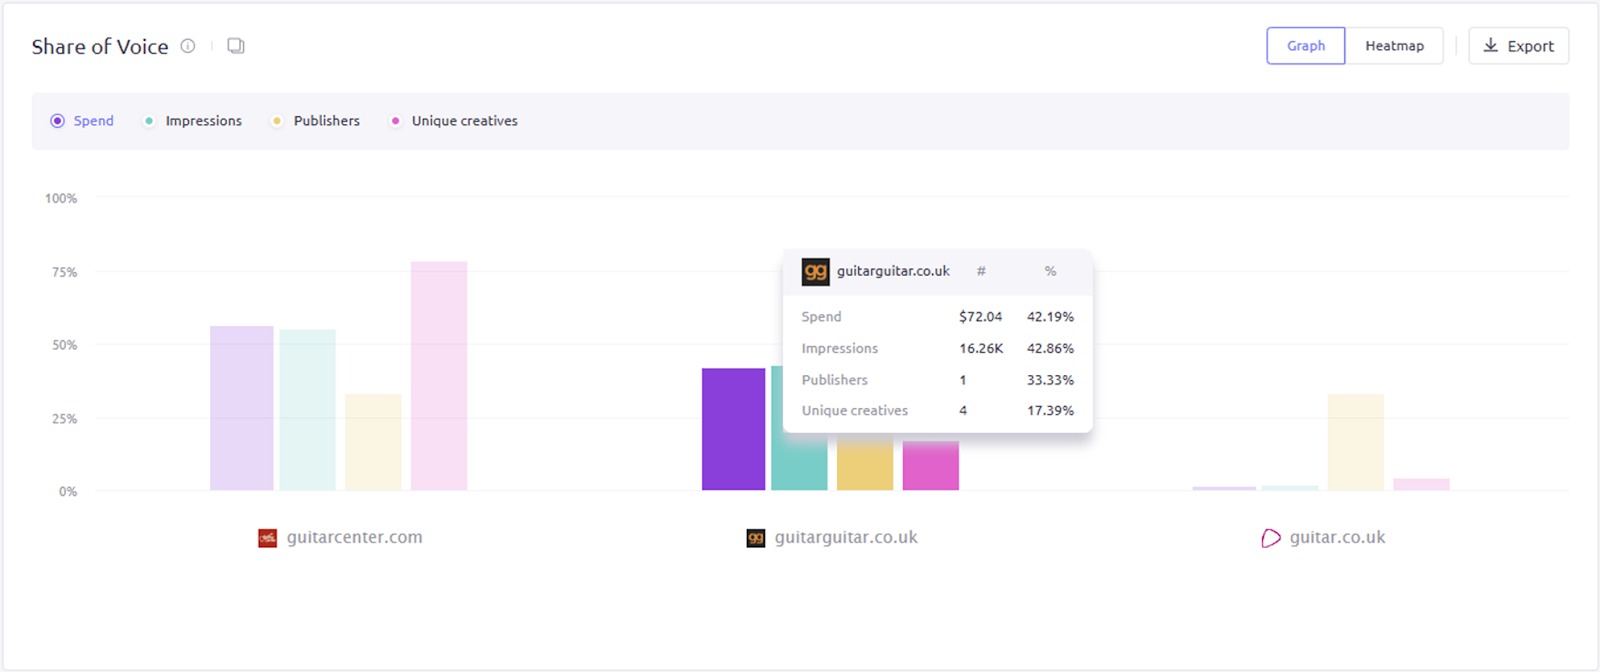
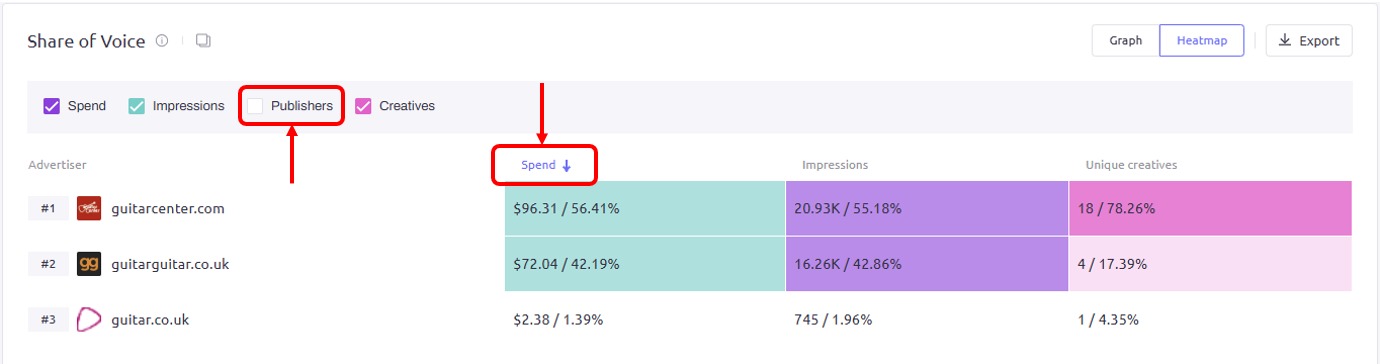
When comparing multiple advertiser domains, you will see a Share of Voice widget at the top of the report. It will contain a breakdown, either as a bar chart or as a heatmap, of the Spend, Impressions, Publishers and Unique Creatives for each entity. You can click on each of the metrics to highlight them in the visualization and hover over any bar to reveal more information.
On the heatmap, you can select the data you want to see in the charts by checking or unchecking the boxes and sort each column by clicking the column headers.
Expenditure Trends
You can use the Expenditure Trend chart to view spending over a daily, weekly, or monthly period for your selected advertisers. Use the drop-down menus in the top-right corner of the widget to change the time period or filter by publisher.
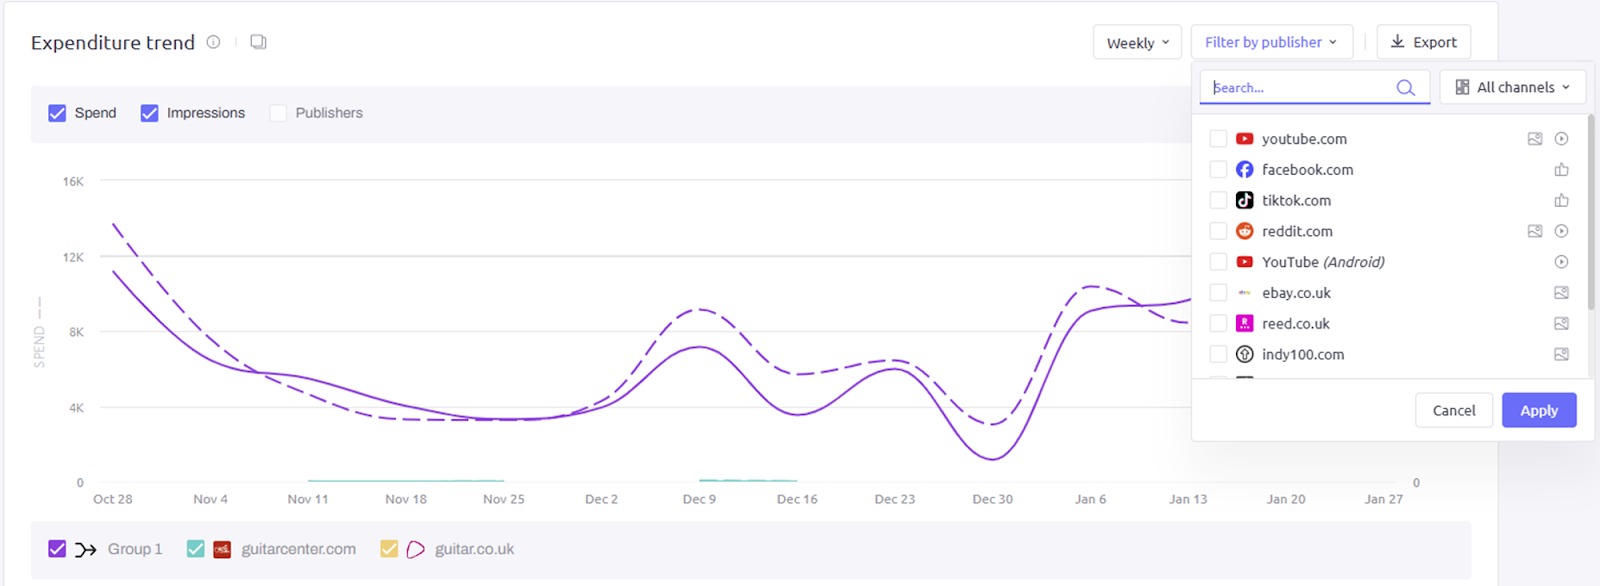
Expenditure trends can be shown in up to two of three possible dimensions:
- Average Spend
- Average Impressions
- Average Number of Publishers or Advertisers
If you’re viewing all channels, this widget will also include an expenditure breakdown section directly below the trends chart.
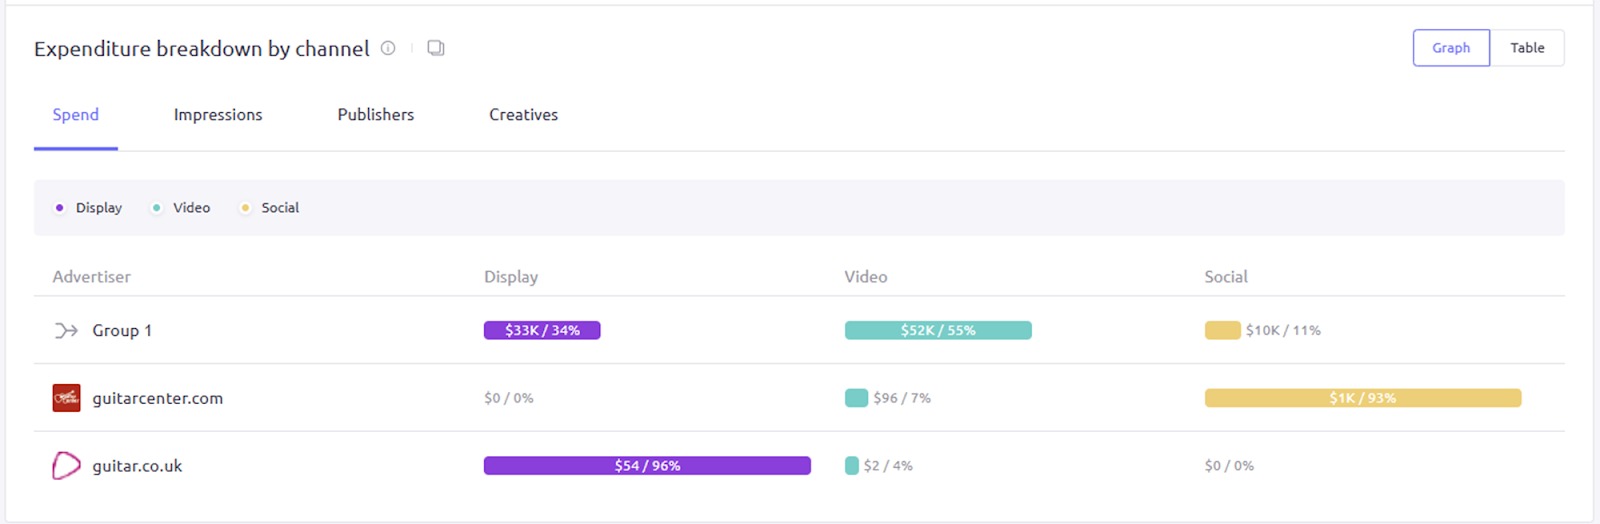
The expenditure breakdown section shows the expenditure for each channel that has data—you can search through Spend, Impressions, Publishers and Creatives for more information. You can also choose to present the data in a table or a graph format via the options in the top-right corner and click on any of the domains for a more detailed report.
Top Ads
The Top Ads widget displays the top-performing ads from the selected domains over the analyzed period. You can sort these by newest (based on the ‘Last seen’ date), total impressions, and duration.
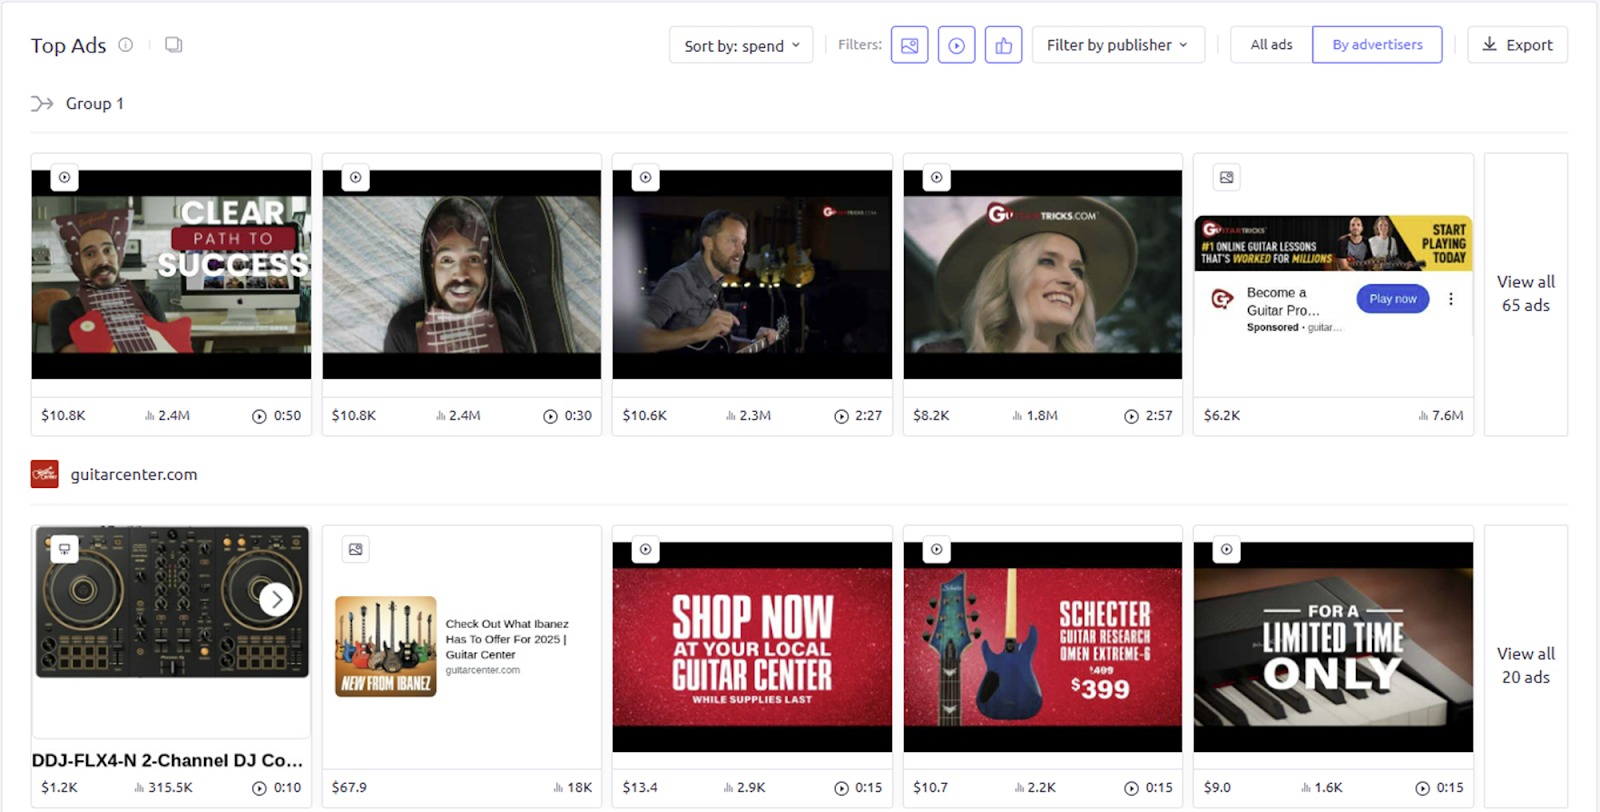
In the top-right corner of the widget, you will find three filters, which you can use to exclude unwanted ad types:
- Hide banner ads
- Hide video ads
- Hide social ads
Click on one of these filters to narrow down your results.
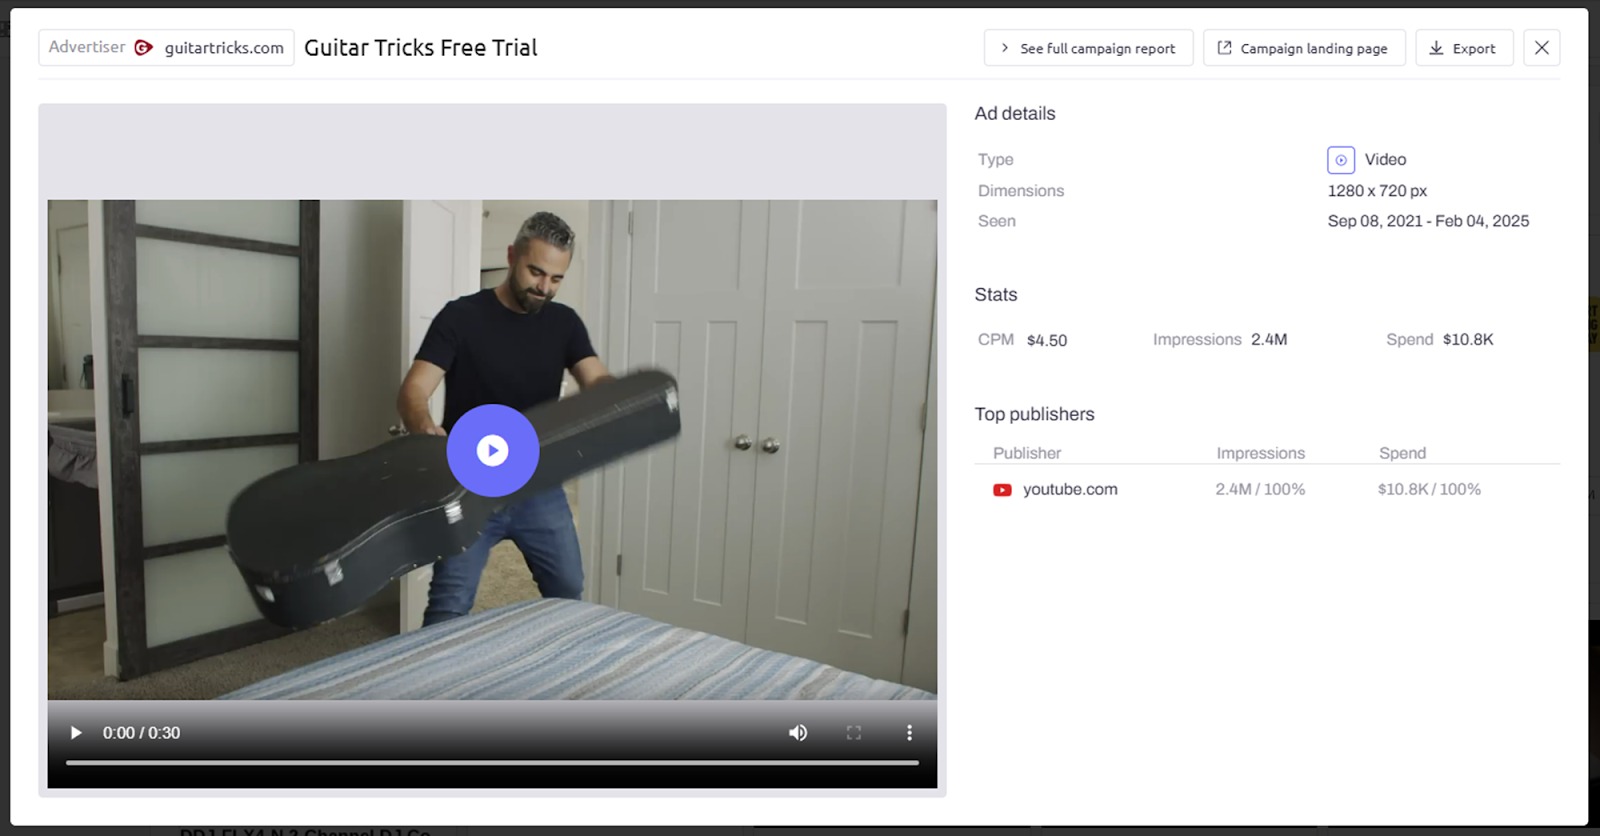
To view more details about an ad, click on the image. A window will appear, showing you an expanded view of that ad and other details, such as:
- Type of Ad
- Dimensions
- Impressions
- Spend
- Publisher (Seen On)
Top Campaigns
Available in all views, the Top Campaigns chart ranks the best-performing campaigns for the analyzed domains during any given period.
The first column on this chart is the name of the campaign. If you click on one of these, you will be taken to a campaign report for that campaign.
If you’re in Comparison Mode, the second column will tell you the relevant publisher or advertiser being compared.
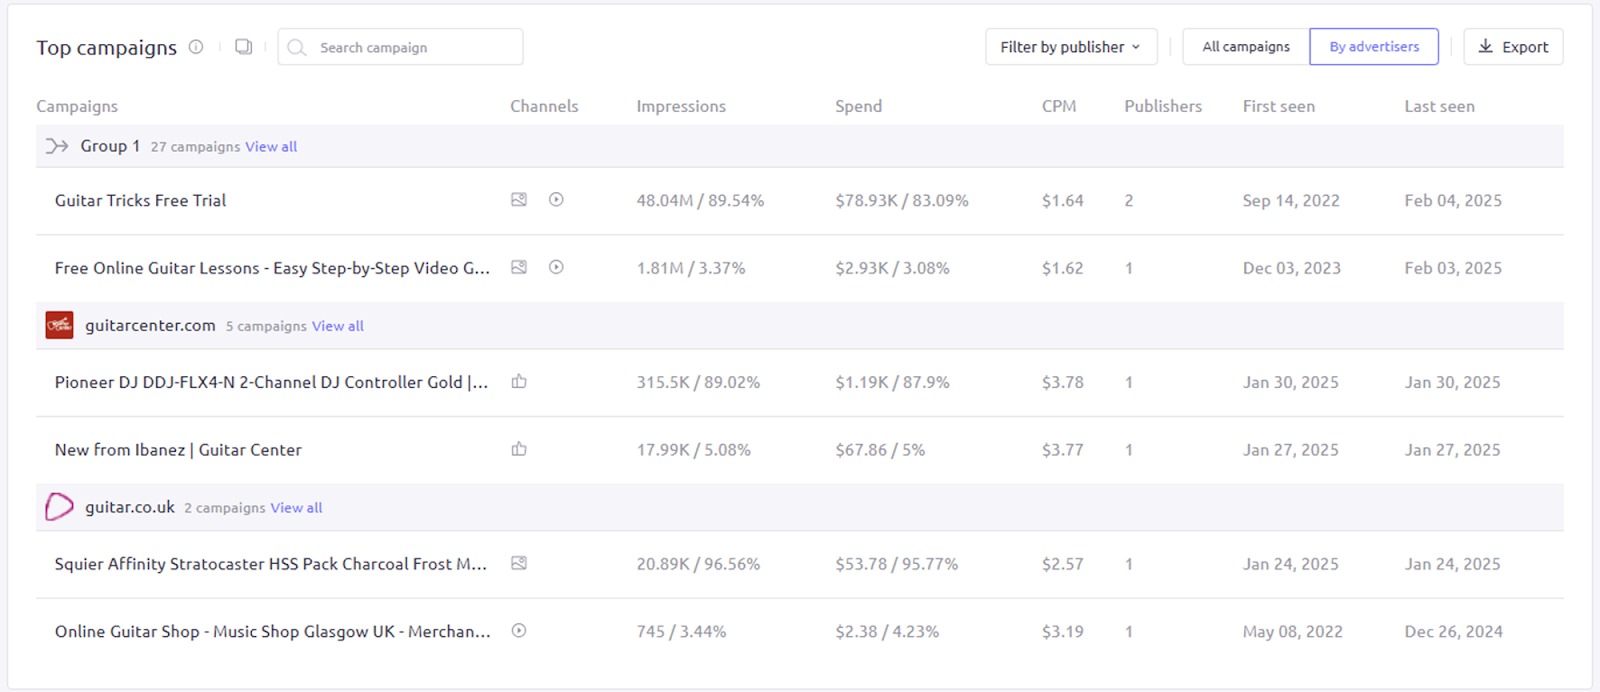
Other data points in this chart include:
- Impressions
- Ad Spend
- Cost per Mille (CPM)
- Number of publishers (for a single domain in Advertiser Overview only)
- Advertiser (for that specific campaign, in Publisher Overview)
- ‘First seen’ and ‘Last seen’ dates
Top Publishers & Top Advertisers
The Top Publishers and Top Advertisers widgets rank the best-performing publishers and advertisers by spend and impressions.
- Top Publishers: Visible when analyzing an advertiser domain (also called Top Publishers and Apps when viewing all channels)
- Top Advertisers: Visible when analyzing a publisher domain
When analyzing a single domain, the top five publisher domains and apps, or the top advertisers, will be listed on the left side of the widget. You’ll see a breakdown of the total share of voice (SoV) under both ‘Spend’ and ‘Impressions’ for each one—you can choose between a bar chart and a table in the top-right corner.
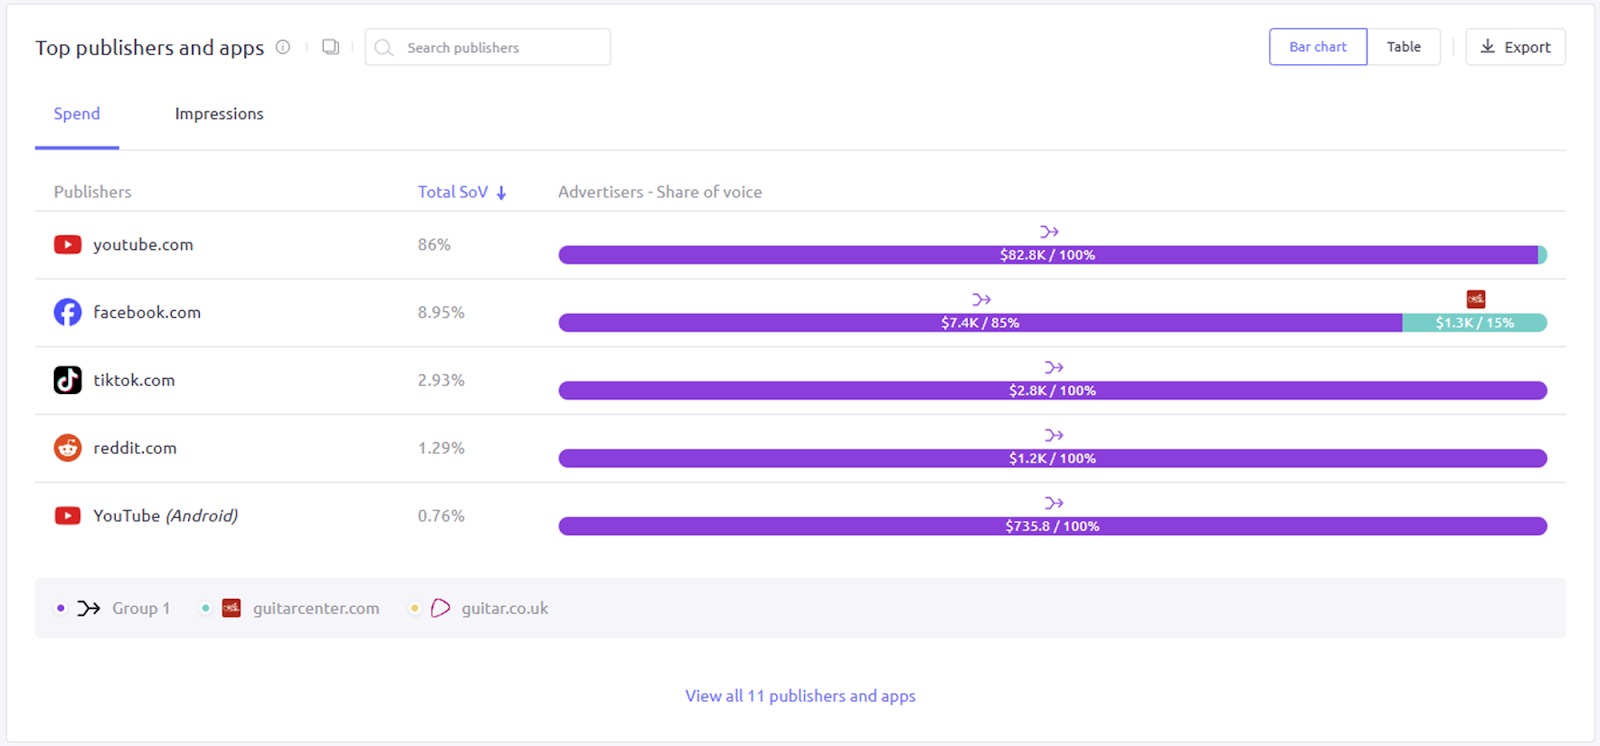
To view the complete list of top publishers or advertisers in a separate report, click on the ‘View all’ link at the bottom of the widget.
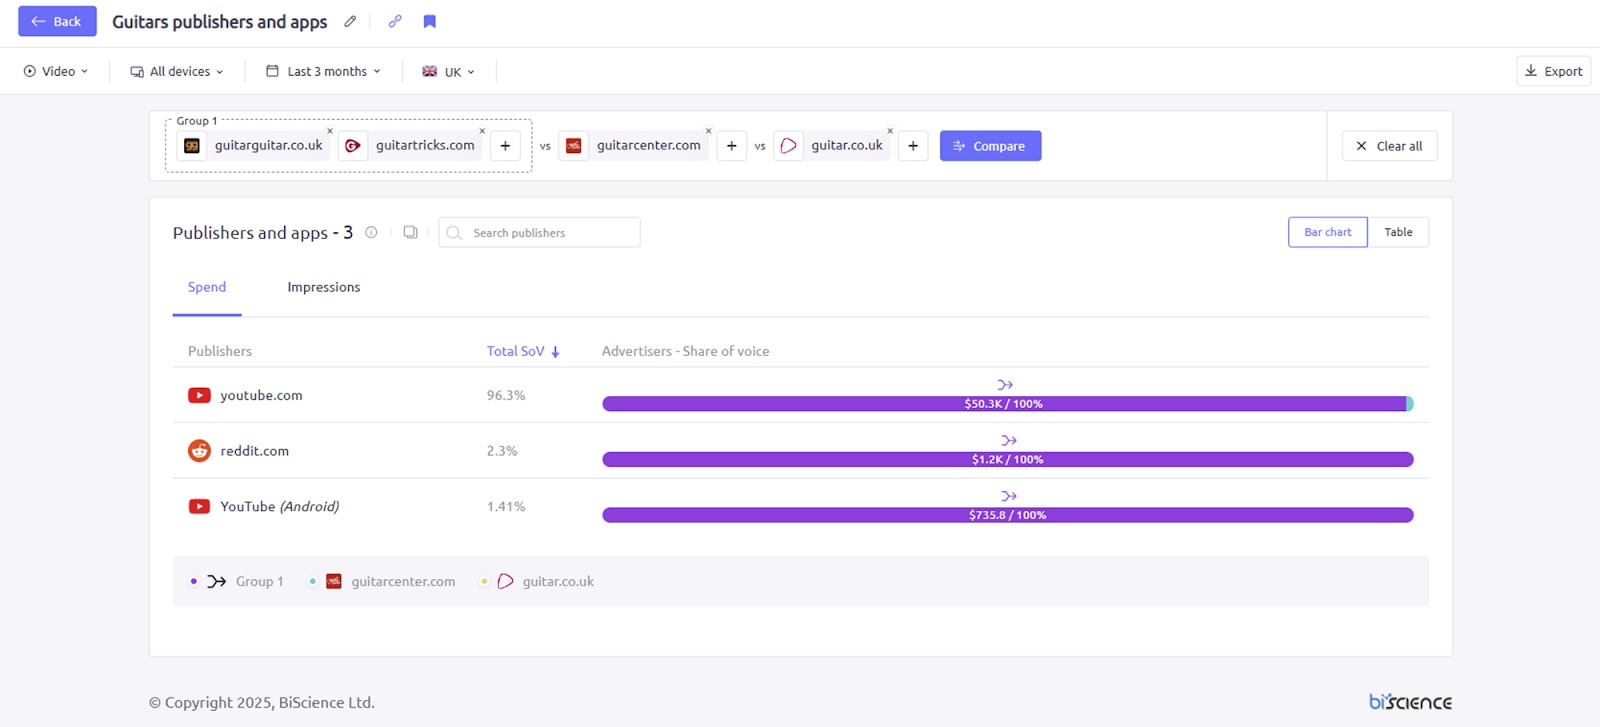
The ‘Back’ button at the top-left of the interface leads back to the original report view.
In Comparison Mode, the widget does not include a ‘View all’ link. Instead, all publishers or advertisers are broken out into pages. You can use the page buttons at the bottom of the widget to change pages or update the amount of items per page.
If you want to learn more about a specific publisher or advertiser listed in this widget, click on its name, and you will be taken to its report.
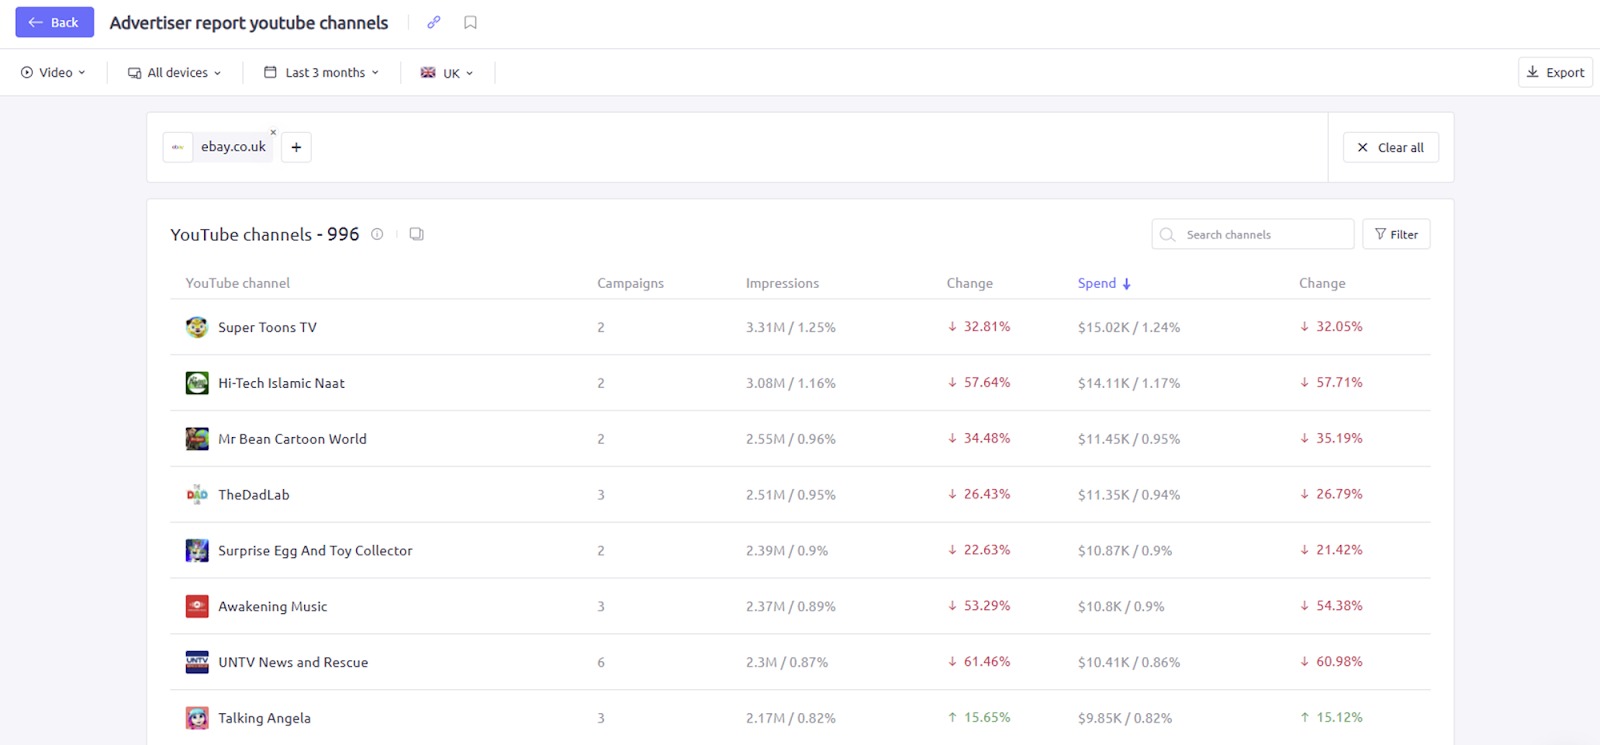
Youtube Channels
When analyzing a single advertiser domain on the video channel, the YouTube Channels widget shows the top channels the advertiser has used to place ads. This does not appear for publishers, or when comparing two domains.
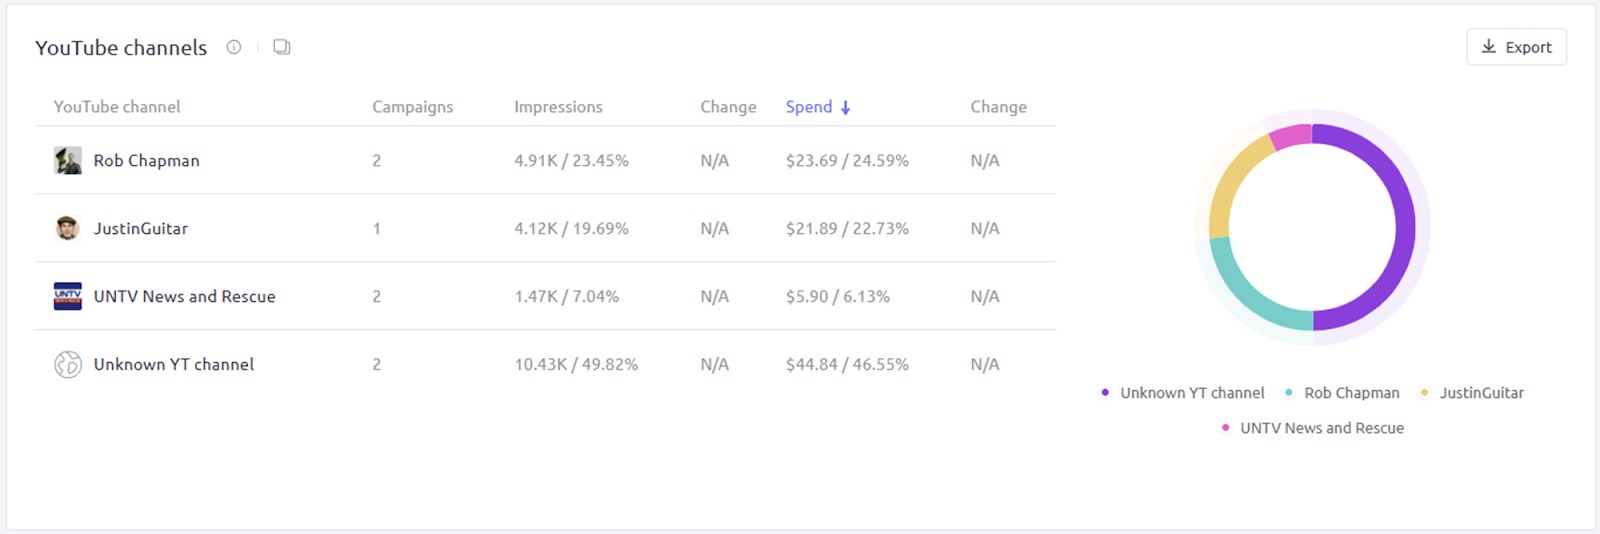
The YouTube Channels widget functions in a similar way to the Top Advertisers or Top Publishers widget. The chart includes:
- Top five channels
- Number of campaigns
- Number and share of impressions, plus % change
- Value and share of advertising spend, plus % change
- Share of voice
Click the ‘View all’ link at the bottom to see a complete list of YouTube channels where the advertiser’s ads were seen within the selected timeframe.
Use the dropdown menu on the right to add a filter, then enter the value range you’re looking for—you can filter by:
- Campaigns
- Impressions
- Share of Voice
- Spend
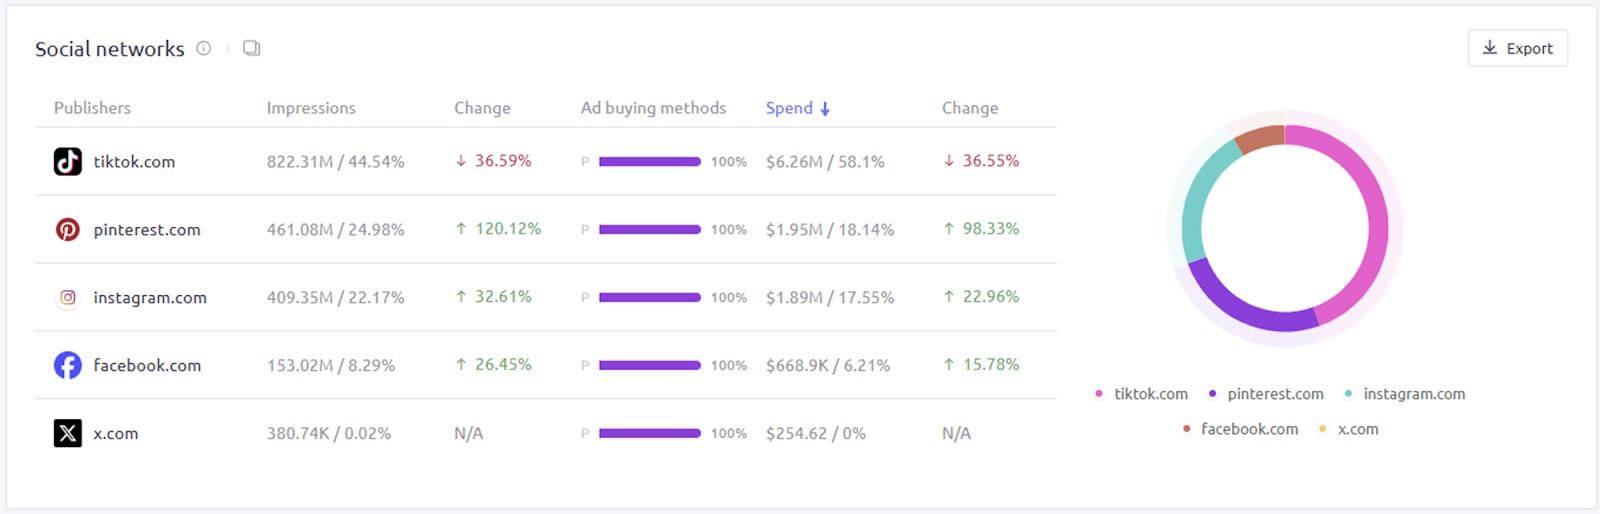
Social Networks
The Social Networks widget appears when you analyze a single advertiser domain on the social channel. It shows you:
- The social platforms where the advertiser’s ads have appeared (including Facebook, Instagram, X, TikTok, Pinterest and LinkedIn)
- The number and share of impressions received, plus % change
- Ad buying methods
- Value and share of advertising spend, plus % change
- Share of voice
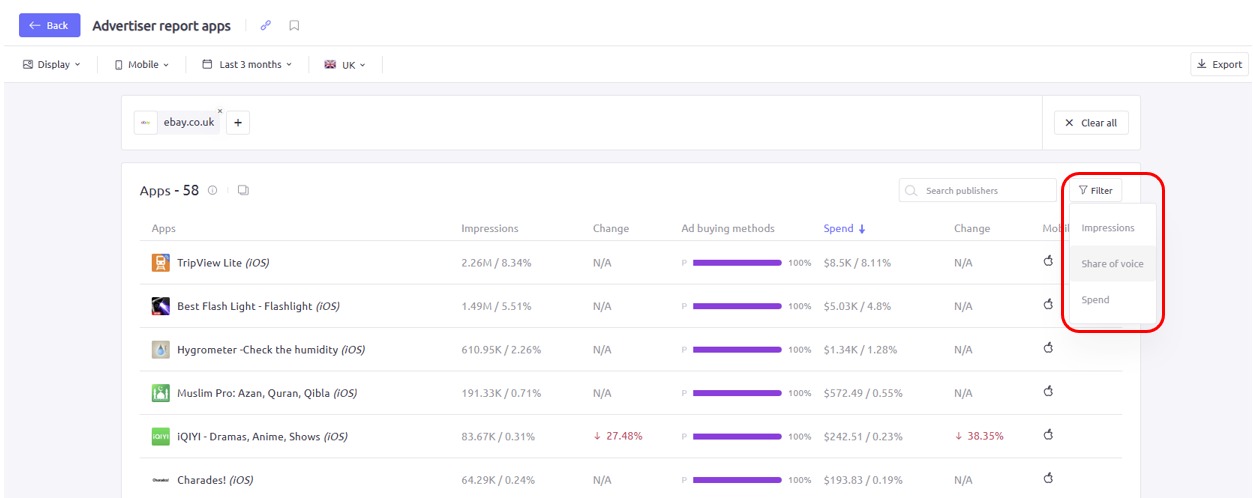
Top Apps
The Top Apps widget appears when you analyze mobile data for a single advertiser domain or group. It ranks the best-performing publisher apps by ad impressions. Please note that if the selected advertiser does not promote itself on apps, this widget may not appear.
On the left side of the app, a chart breaks down the top five publisher apps by:
- Impressions, plus % change
- Ad buying methods
- Spend, plus % change
- Mobile OS (e.g. Apple vs Android)
- Share of voice
The share of voice for the top five apps will be displayed in a pie chart to the right.
To view a complete list of apps included in this report, click the ‘View all apps’ link at the bottom of the widget. The full report can be filtered by:
- Publisher (search by name)
- Impressions
- Share of Voice
- Spend
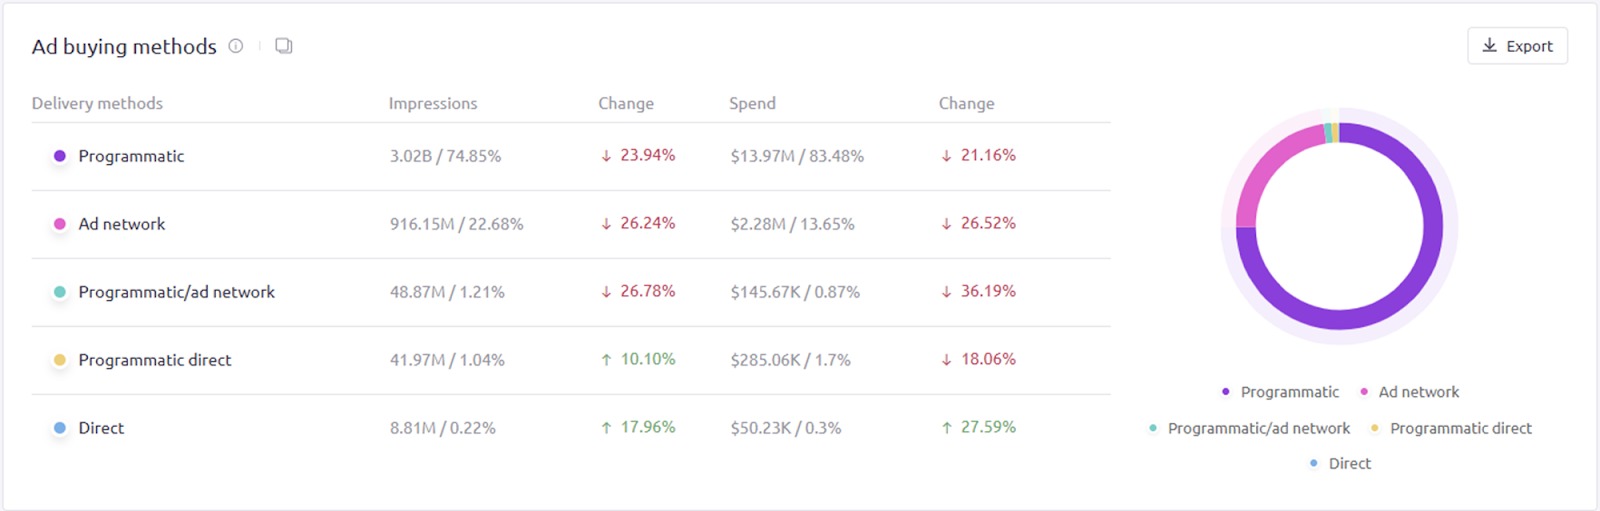
Ad Buying Methods (Full)
The second Ad Buying Methods widget shows a more detailed breakdown of the methods used by advertisers to buy ads displayed by publishers. This widget includes five different ad buying methods:
- Ad Network: Ads purchased through a network such as Google Display Network
- Programmatic: Ads purchased using an automated method, typically through an ad exchange
- Direct: Ads purchased directly through the publisher
- Programmatic/ad network: Ads purchased using a programmatic method through an ad network
- Programmatic direct: Ads purchased directly from the publisher via a programmatic method
When analyzing a single domain, this widget includes a chart on the left, breaking down the impressions and spend for each buying method, plus % change for each. On the right will be a pie chart that depicts the share of voice for each method.
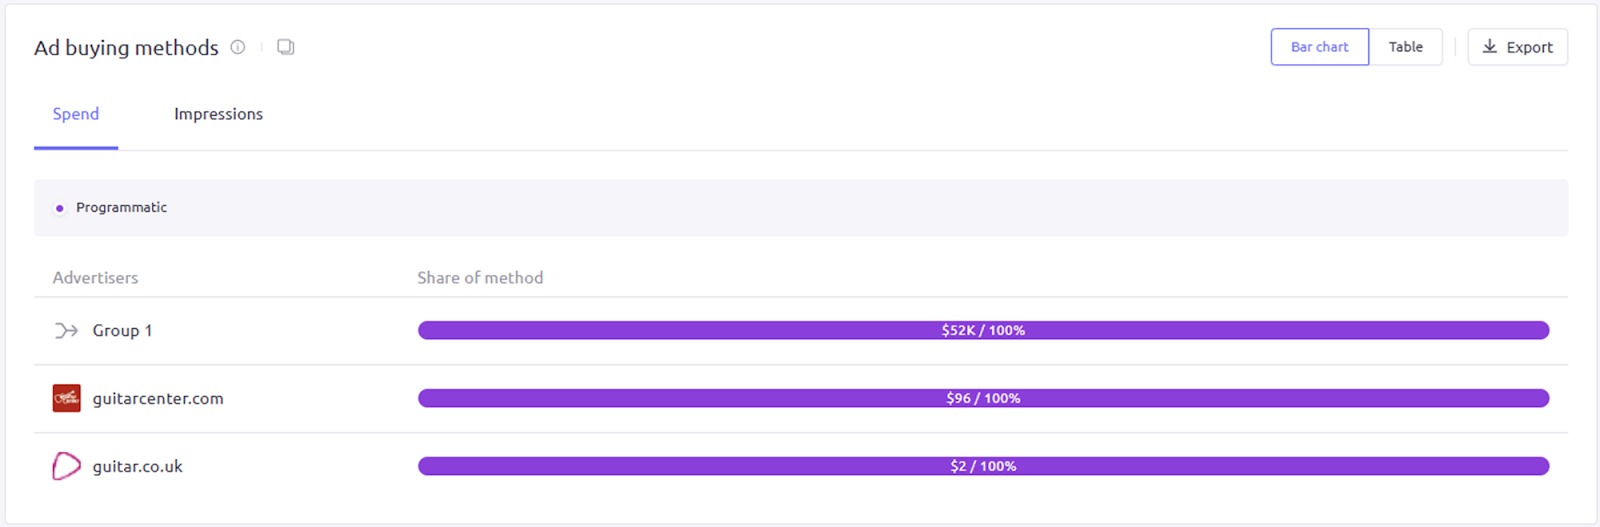
In Comparison Mode, this widget will instead appear as a bar graph, depicting the share of voice by buying method for each compared domain:
Email Notifications
With the Email Notifications functionality, you can configure Weekly or Monthly notifications for the advertisers and publishers to which you are subscribed. By enabling notifications, you will automatically receive the following:
- Key performance metrics insights for top campaigns
- Highlights of creative content, allowing you to identify which ads are generating results
To start using the notifications, you need to enable them by clicking on the gear icon located in the header of the application and activating the option to receive email notifications.
Next, subscribe to the advertisers and publishers that interest you via the ‘bell’ icon in the top-left of the page.
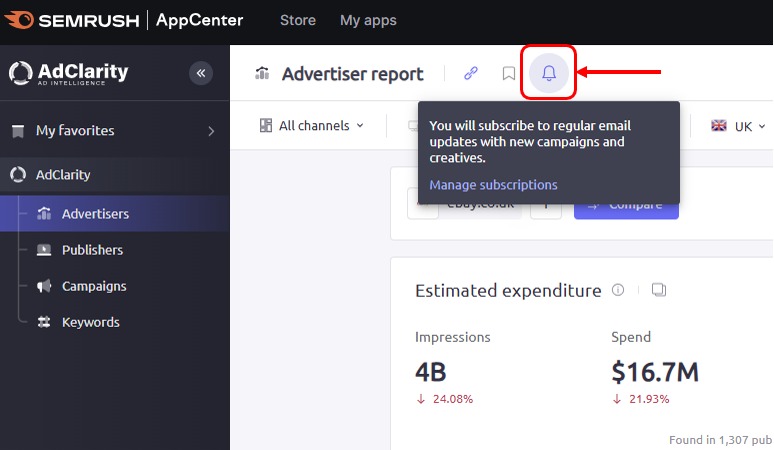
If you wish to subscribe to a group of advertisers or publishers, please ensure that the group has been saved beforehand via the ‘bookmark’ icon next to it.
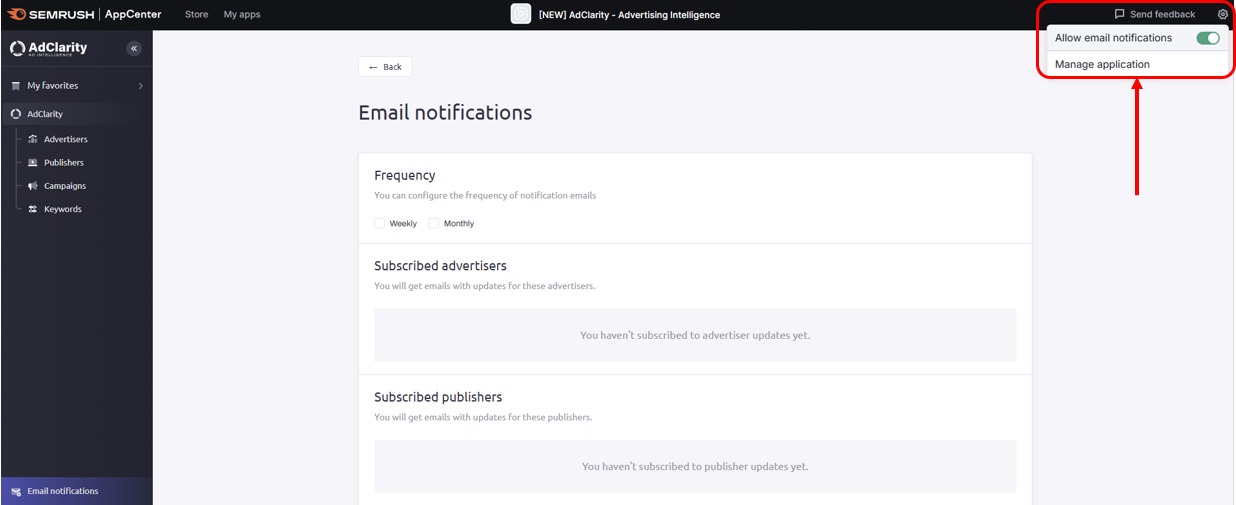
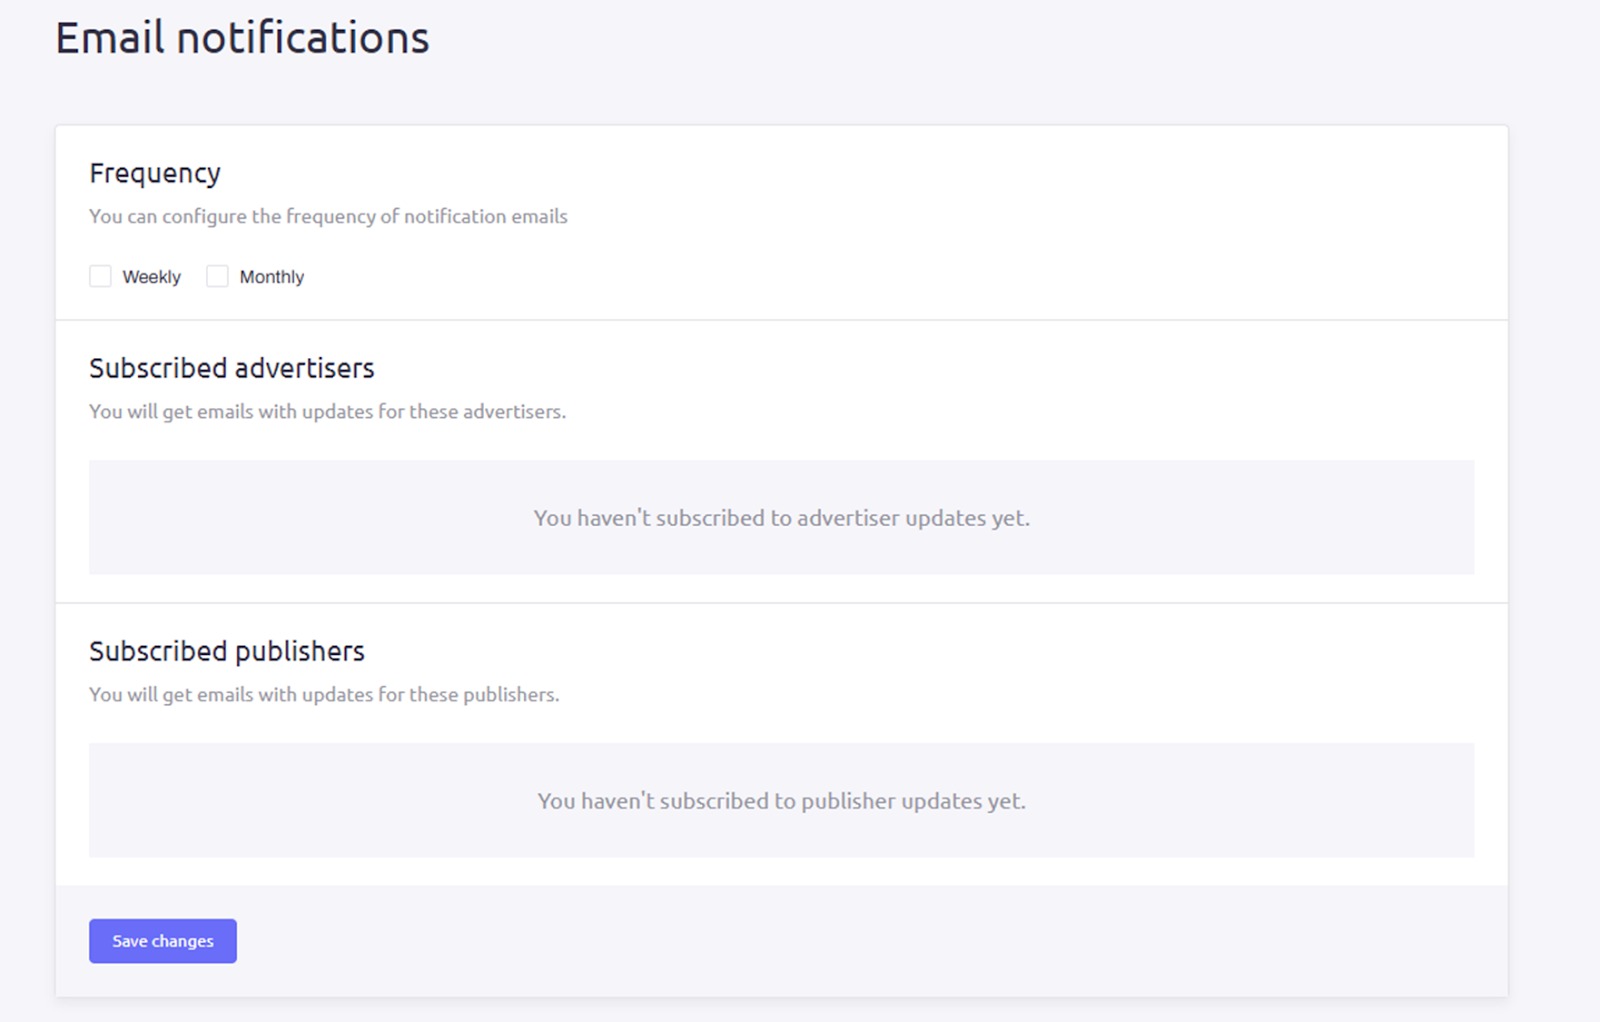
Managing Email Notifications
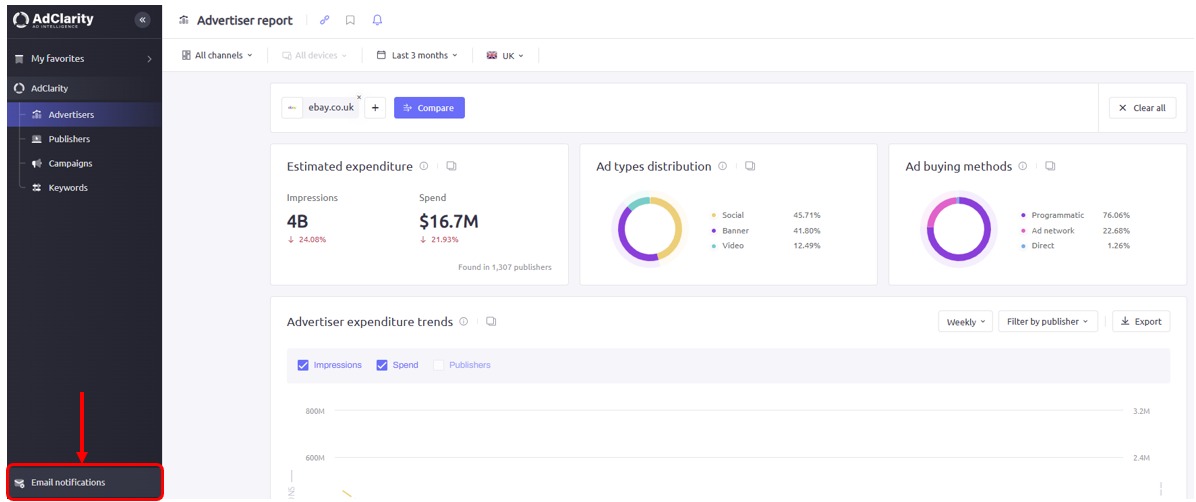
To access the Email notifications menu, simply navigate to the bottom-left corner of the app interface.
There, you will have the ability to adjust the frequency of the updates and manage all the advertisers and publishers to whom you have subscribed.
If you have other questions about the App Center or the AdClarity — Advertising Intelligence app, please email us directly at app-center@semrush.com.